$SPONGE (SPONGE/USD) Sputters at $0.00005 – Can Bulls Bounce Back?
Estimated Reading Time: 2 minutes
Don’t invest unless you’re prepared to lose all the money you invest. This is a high-risk investment and you are unlikely to be protected if something goes wrong. Take 2 minutes to learn more

The $SPONGE is facing a familiar foe – the $0.00005 resistance level. Just like in past attempts, the price has been pushed back, leaving bulls regrouping at $0.00003, licking their wounds and plotting their next move. The worry is this repeated rejection might make the resistance even stronger, creating a daunting wall to climb. To make matters worse, bulls haven’t been able to solidify their grip on $0.00004, adding another hurdle to their ascent.
Key Market Dynamics:
- Resistance Levels: $0.0010, $0.0011, and $0.0012
- Support Levels: $0.000035, $0.000030, and $0.000025
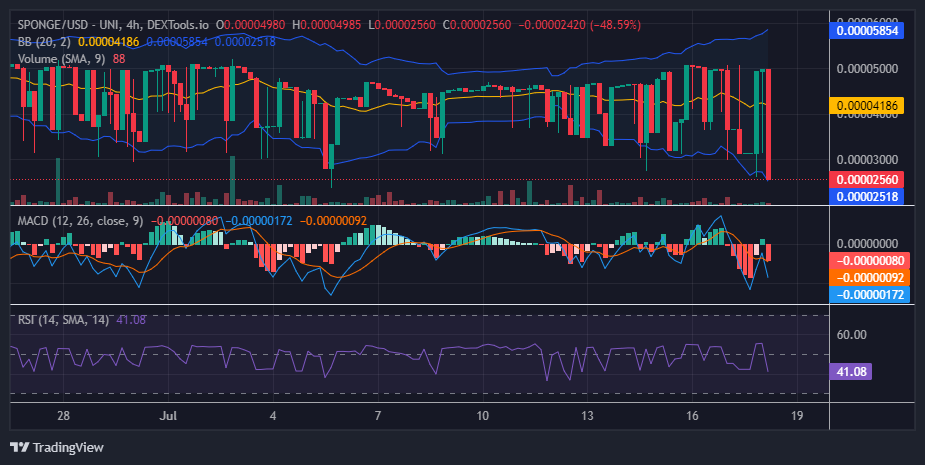
SPONGE/USD Technical Outlook
The $0.00004 level has been a historical turning point. Previously, bulls needed to establish a foothold here before conquering the $0.000045 resistance. However, things have gotten shakier recently. The Bollinger Bands are expanding, indicating heightened volatility. This is hurting the bulls more than the bears. While bears are holding firm at $0.00005, bulls are struggling to find their footing at $0.00004.
Despite the setbacks, there’s a flicker of bullish resilience (considering this crypto signal). This significant price drop might entice some traders to “buy the dip,” potentially triggering a bounce.
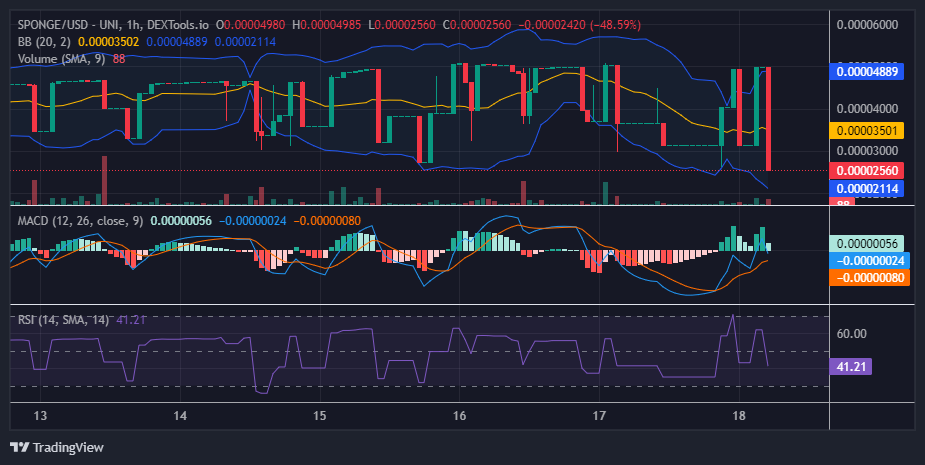
$SPONGE (SPONGE/USD) 1-Hour Chart Insights
The 1-hour chart reflects the volatility mirrored by the Bollinger Bands. Take a look at that prominent bearish marubozu candlestick and the fading green histogram on the MACD indicator. Notice the inconsistencies – smaller green histograms next to taller, healthier ones? That’s volatility in action.
Taking a position in this market might feel like navigating a storm. But here’s a silver lining: historically, SPONGE/USD tends to bounce back in this price range. While the current volatility might cause some wild swings, there’s a chance for a rally. However, keep your eyes peeled and be prepared for a bumpy ride!
Buy SPONGE/USD!
Brb, gotta go watch the $SPONGE chart 🧽💦💦 pic.twitter.com/Fcm5pDM8at
— $SPONGE (@spongeoneth) July 16, 2024