$SPONGE (SPONGE/USD) Traders Face Uncertainty at $0.00005; Bullish Momentum Builds Below $0.00003
Estimated Reading Time: 3 minutes
Don’t invest unless you’re prepared to lose all the money you invest. This is a high-risk investment and you are unlikely to be protected if something goes wrong. Take 2 minutes to learn more

The SPONGE/USD market has fallen short of the $0.00005 price level again, with the price reversing as bulls regroup below the $0.00003 level for another attempt at a bull run. The concern is that repeated rejections at the $0.00005 price level may strengthen this resistance, making it more challenging for bullish traders to break through. Additionally, bulls have not been able to secure stability at the $0.00004 price level, further complicating their efforts.
Key Market Dynamics:
- Resistance Levels: $0.0010, $0.0011, and $0.0012
- Support Levels: $0.000035, $0.000030, and $0.000025
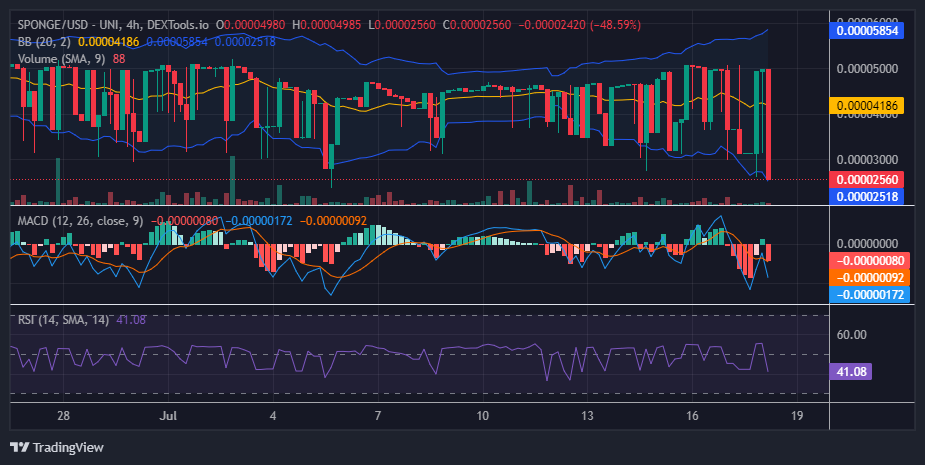
$SPONGE Technical Outlook
The $0.00004 price level has been a concern for bullish traders. In previous markets, bullish traders needed to establish stability at this level before breaking the stubborn resistance at $0.000045. Recently, however, the market has become more volatile, as illustrated by the Bollinger Bands indicator, which shows expanding bands. This volatility is affecting the bullish position more than the bearish position at $0.00005. SPONGE/USD Bears have maintained the $0.00005 price level, while bulls struggle to maintain stability at $0.00004. Despite this, bullish traders remain resilient and are making significant efforts to mitigate a downtrend. This current significant price low may encourage more traders to buy the dip, potentially leading to a significant bounce.
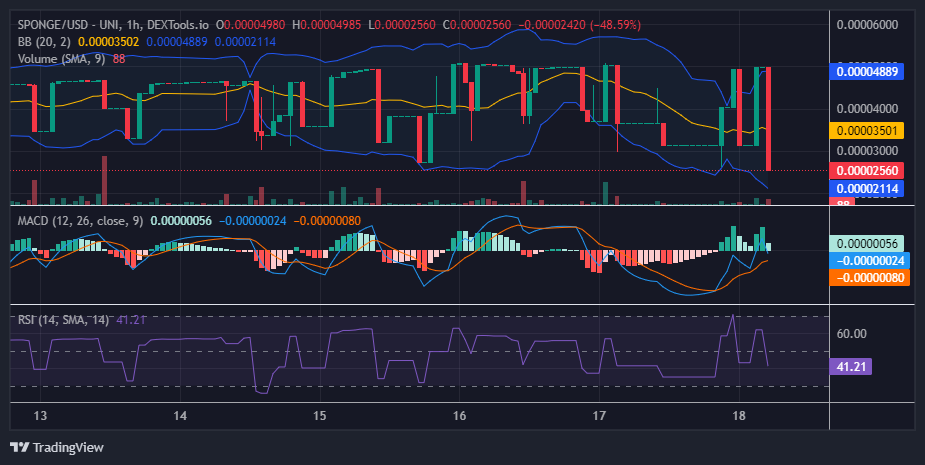
$SPONGE (SPONGE/USD) 1-Hour Chart Insights
The price dispersion indicated by the Bollinger Bands is also evident on the 1-hour chart, highlighting the current market volatility. Observe the large marubozu bearish candlestick alongside the faded green histogram of the Moving Average Convergence and Divergence (MACD) indicator. You will notice discrepancies, such as the smaller faded green histogram next to the taller, fully green histograms. This phenomenon clearly illustrates a volatile market.
Traders might find it challenging to take positions in this market (taking the current crypto signal into consideration). However, despite this volatility, historical market behavior suggests that the SPONGE/USD market typically rebounds in this price territory. The market has always rallied at this level. Given the current volatility, the price may fluctuate rapidly between upper and lower levels.
Buy $SPONGE!
Brb, gotta go watch the $SPONGE chart 🧽💦💦 pic.twitter.com/Fcm5pDM8at
— $SPONGE (@spongeoneth) July 16, 2024
Invest in the hottest and best meme coin. Buy Sponge ($SPONGE) today!