SPONGE/USD ($SPONGE) Daily Outlook: Technical Signals Point Toward Market Shift
Estimated Reading Time: 2 minutes
Don’t invest unless you’re prepared to lose all the money you invest. This is a high-risk investment and you are unlikely to be protected if something goes wrong. Take 2 minutes to learn more

The $SPONGE market appears to be approaching a critical juncture, as technical indicators on the daily timeframe suggest a potential shift in trend. Buyers have consistently defended the $0.0001 level, creating a strong base of support that has held firm despite persistent bearish attempts. This prolonged period of price stabilization has dulled downward momentum, hinting that a significant market move may be forming beneath the surface.
Price Zones to Monitor
-
Resistance: $0.000110, $0.000120, $0.000130
-
Support: $0.000090, $0.000085, $0.000080
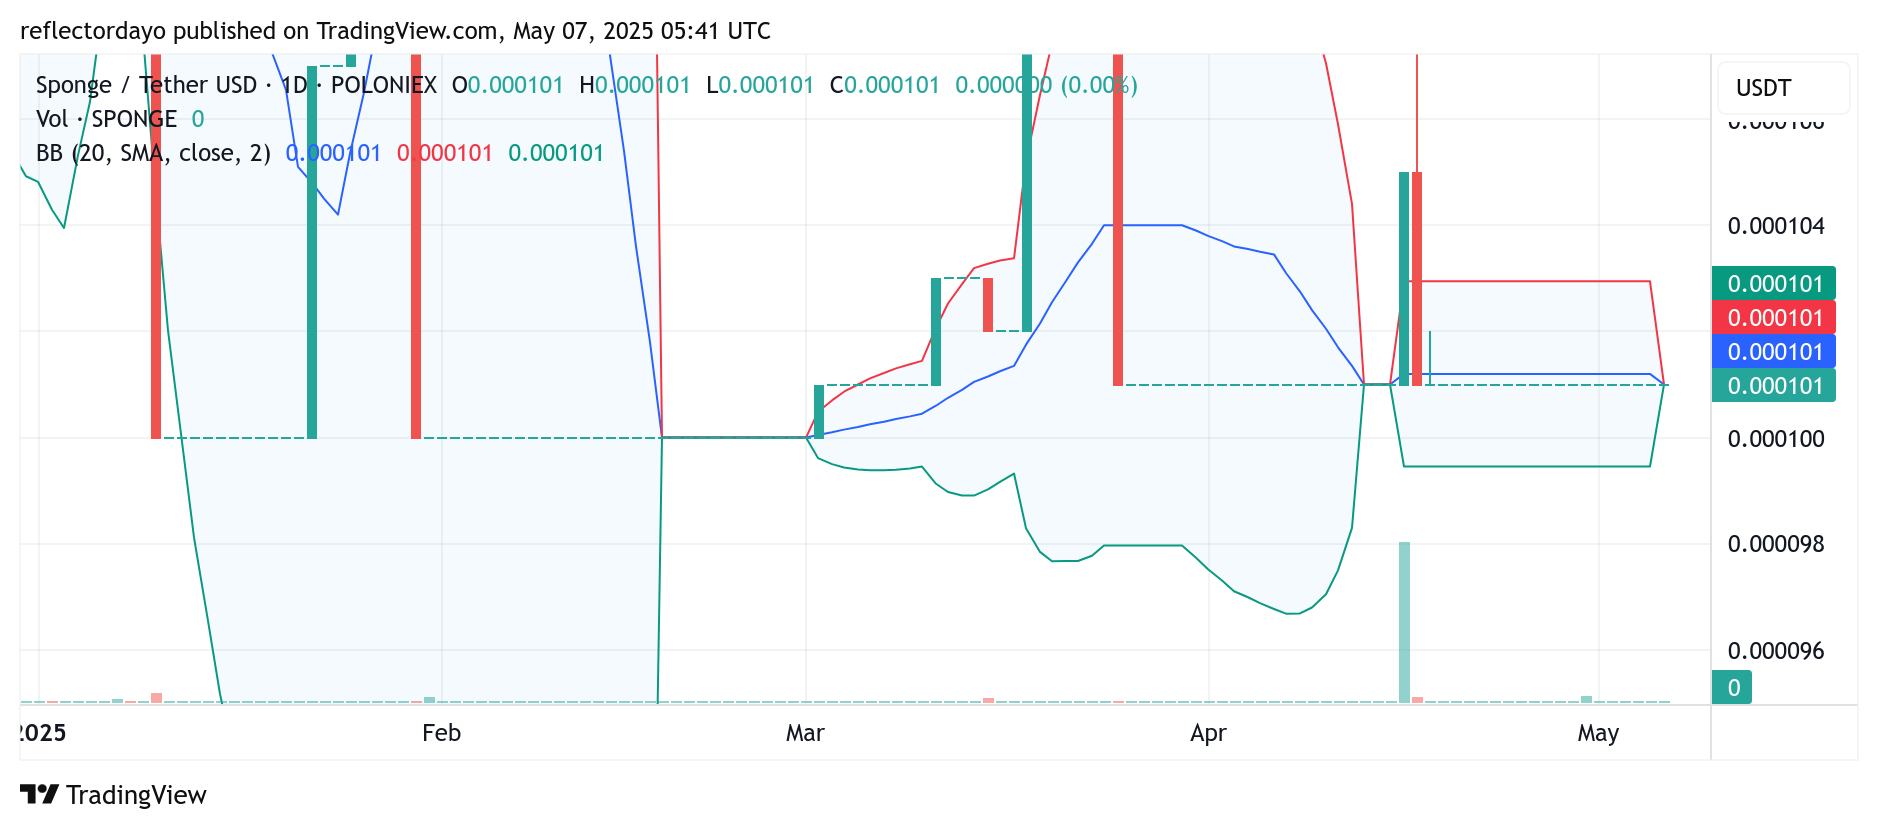
$SPONGE Daily Chart Insight: Compression of Volatility May Set Stage for Breakout
A notable development on the $SPONGE daily chart is the sharp narrowing of the Bollinger Bands around the $0.0001 price zone. This technical formation, known as a volatility squeeze, typically follows a period of sideways movement and reduced market activity. The squeeze reflects market indecision, where buying and selling forces are in near equilibrium. Historically, such setups precede explosive price action once momentum returns—making this a phase to watch closely for breakout confirmation.
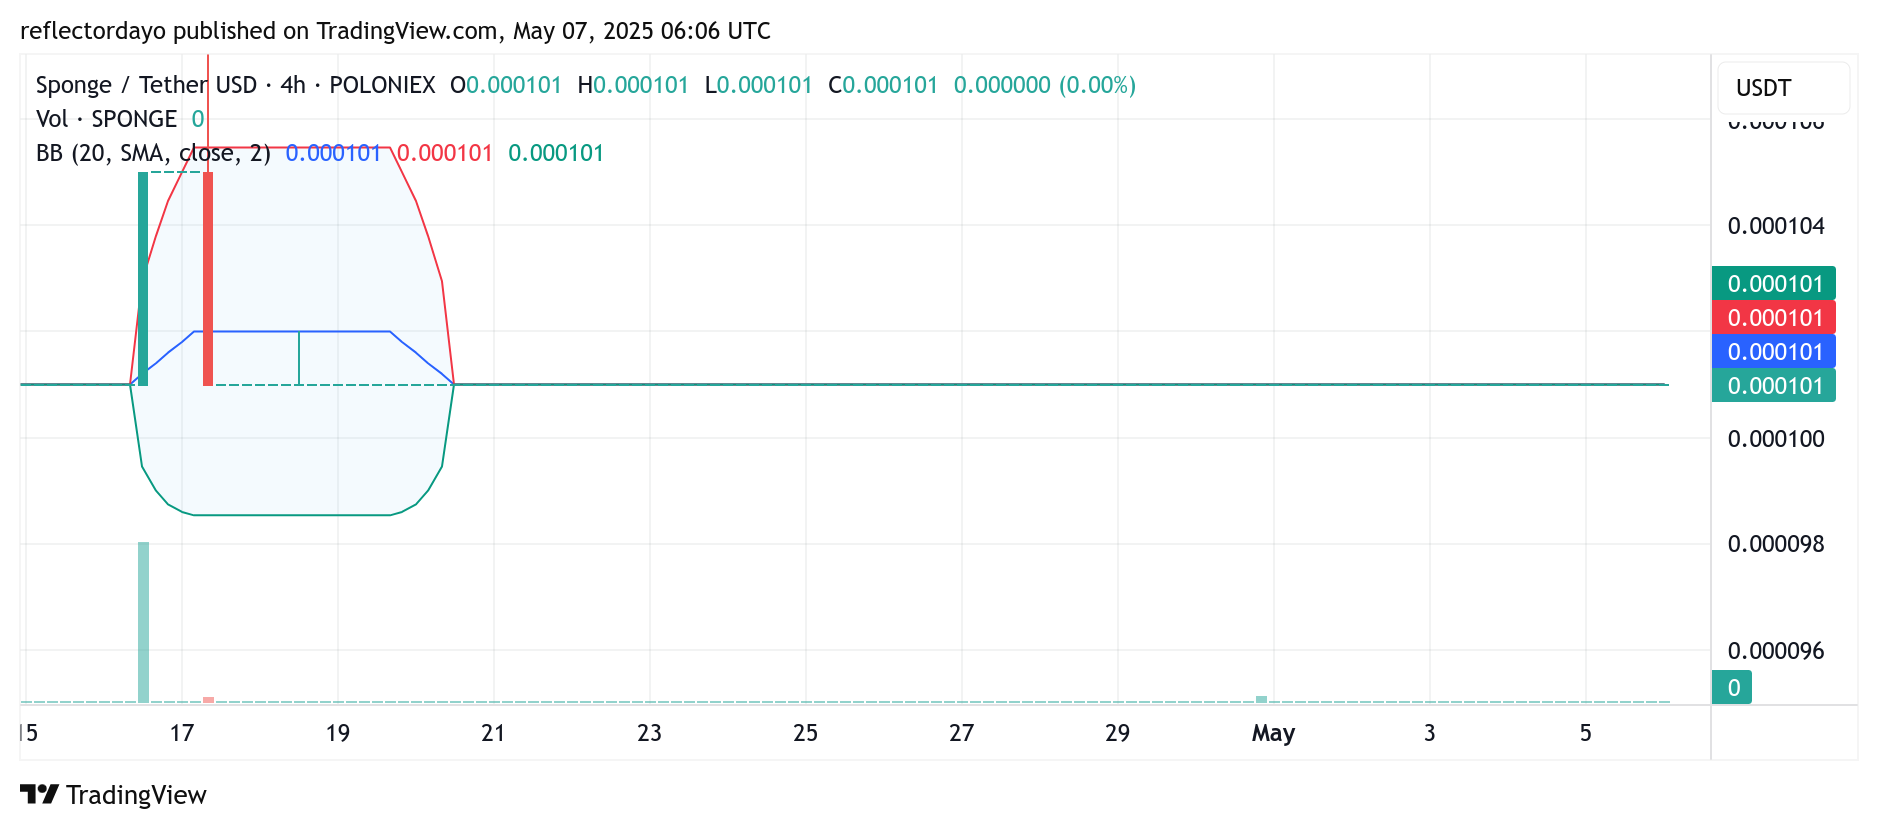
SPONGE/USD 4-Hour Chart: Tight Price Range Builds Breakout Potential
Looking more closely at the 4-hour chart, the Bollinger Bands have been in a contracted state for an extended period. This has resulted in a narrow consolidation channel centered around $0.0001, underlining the market’s suppressed volatility. With the market tightly coiled and directional pressure building, this scenario could serve as an early entry point for bullish traders aiming to capitalize on a possible upward breakout.
Buy SPONGE/USD!
Don’t be the guy who faded pic.twitter.com/tC1QJmLOkj
— $SPONGE (@spongeoneth) May 2, 2025
Join the SPONGE community and get in on the next big crypto opportunity! Buy Sponge ($SPONGE) today