Sui (SUI/USD) Market Maintains Persistent Downside Structure Amid Selling Bias
Estimated Reading Time: 3 minutes
Don’t invest unless you’re prepared to lose all the money you invest. This is a high-risk investment and you are unlikely to be protected if something goes wrong. Take 2 minutes to learn more

Sui Price Prediction — November 18
SUIUSD market maintains persistent downside structure amid selling bias. The overall technical structure of SUIUSD remains bearish as the price continues to trade below the short-term moving average while momentum indicators highlight diminishing buying power.
The MACD histogram shows continued weakness with bearish bars persisting, and both MACD lines remain positioned below the zero level, reinforcing downside sentiment. Market sentiment suggests that sellers still maintain control of the prevailing trend, with no strong evidence of bullish recovery at current levels.
SUI/USD Market Key Levels:
Resistance levels: $2.2160, $3.0670, $3.8490
Support levels: $1.7160, $1.1180, $0.7000

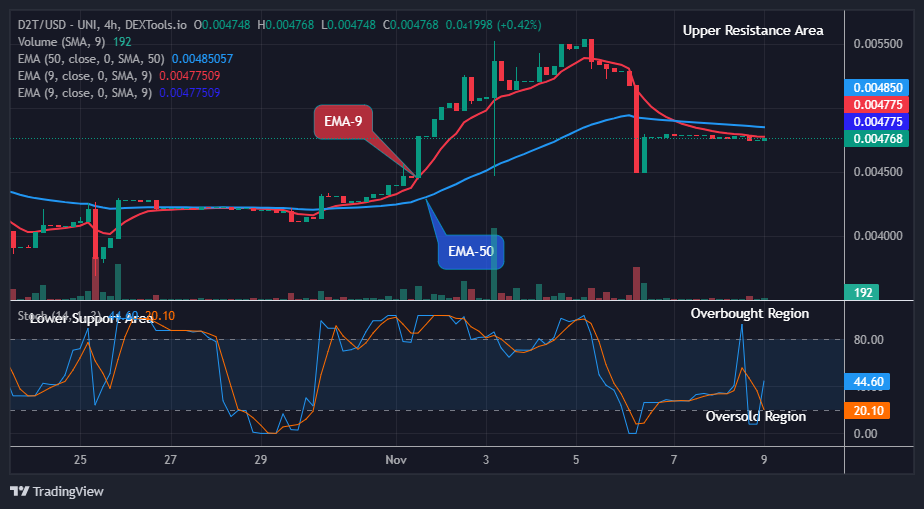
SUI/USD – Daily Chart
The SUI/USD daily chart shows a continuous decline as support levels fail.
Technically, price is reacting to a bearish order block around the $2.210 zone, where upward attempts have been met with resistance. The rejection near this zone aligns with previous supply levels, while the downward trajectory has extended toward the $1.650 region. The structure of lower highs and lower lows persists, indicating sustained bearish momentum and limited interest from buyers to establish a reversal. Price also remains below the 9-period SMA, supporting the continuation of bearish market positioning.
SUI/USDT remains in a firm downtrend, with price consistently forming lower highs and lower lows, confirming strong bearish momentum. The descending trend line has been respected twice, each touch triggering a notable selloff, showing that sellers continue to defend this resistance level. A retest of the trend line around the $2.59–$2.58 zone, combined with bearish candlestick confirmation, would signal a continuation of the downward move. However, a clean break above the trend line could indicate early bullish intent. In that scenario, traders should wait for a retest near $2.57–$2.56 and a strong bullish candle before considering long positions. Overall bias remains bearish unless price breaks and retests the trend line convincingly.
What is the projection for the SUIUSD market?
If selling pressure accelerates, downward expansion could target the next key support around $1.180. A break below that level may open the path toward the lower liquidity area near $0.700, where long-term demand could emerge. Unless price breaks and sustains above $2.210, bearish continuation remains the most probable outcome.
Sui (SUI) Current Statistics
The current price: $1.6450
Market Capitalisation: $6,020,000,000
Trading Volume: $1,240,000,000
Place winning SUI trades with us. Get SUI here