SPONGE/USD ($SPONGE) Price Outlook: Early Signs of Bullish Momentum as May Begins
Estimated Reading Time: 3 minutes
Don’t invest unless you’re prepared to lose all the money you invest. This is a high-risk investment and you are unlikely to be protected if something goes wrong. Take 2 minutes to learn more

The $SPONGE (SPONGE/USD) market continues to consolidate around the $0.0001 level, highlighting the resilience of bullish traders and reducing the likelihood of a breakdown below this critical support zone. On the daily chart, subtle signs of a potential rebound are beginning to emerge. Notably, the volume indicator has shown a modest uptick, suggesting that buying interest may be gradually returning to the market.
As the new month unfolds, this underlying support—combined with increasing trading activity—could pave the way for a bullish shift if momentum builds.
Key Levels to Watch
- Resistance: $0.000110, $0.000120, $0.000130
- Support: $0.000090, $0.000085, $0.000080
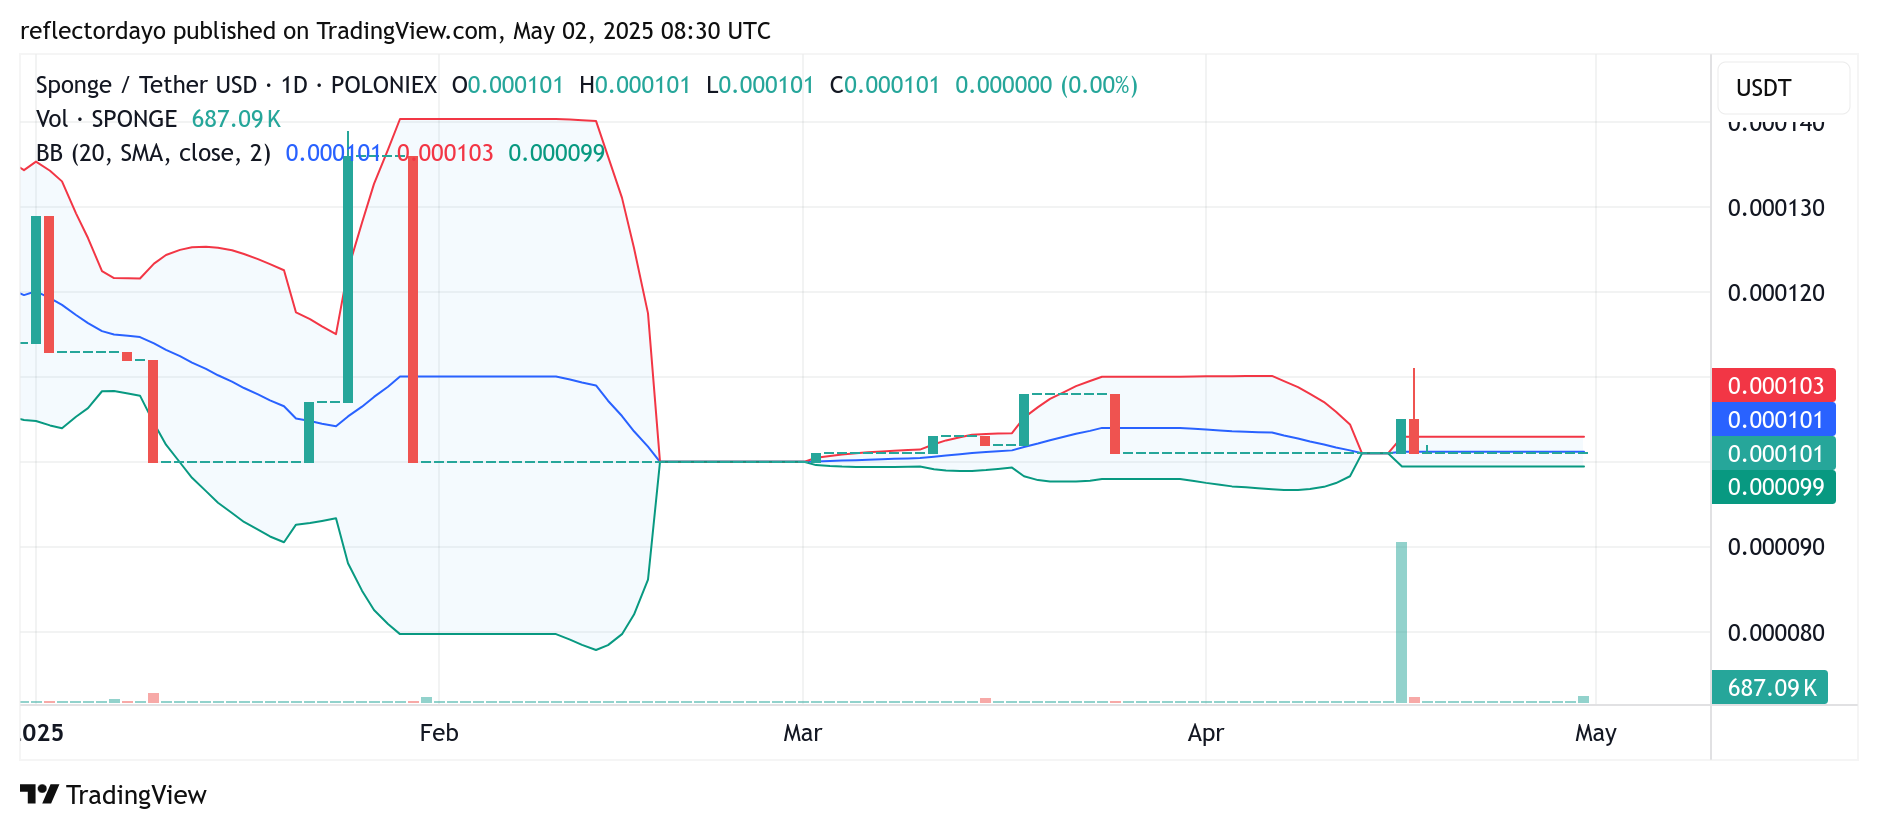
SPONGE/USD Daily Chart Analysis: Subtle Accumulation Signals Potential Upside Breakout
The SPONGE/USD daily chart reveals signs of a potential shift in market dynamics as the new month begins, with momentum likely tilting in favor of the bulls. The prolonged consolidation phase appears to have drained bearish pressure, while subtle accumulation hints at an impending bounce.
Although the Bollinger Bands have yet to confirm a classic volatility squeeze, a sudden price surge toward the $0.000011 level remains possible. For this bullish outlook to materialize and sustain, the market must establish a higher support level—one strong enough to underpin a transition into a higher price range.
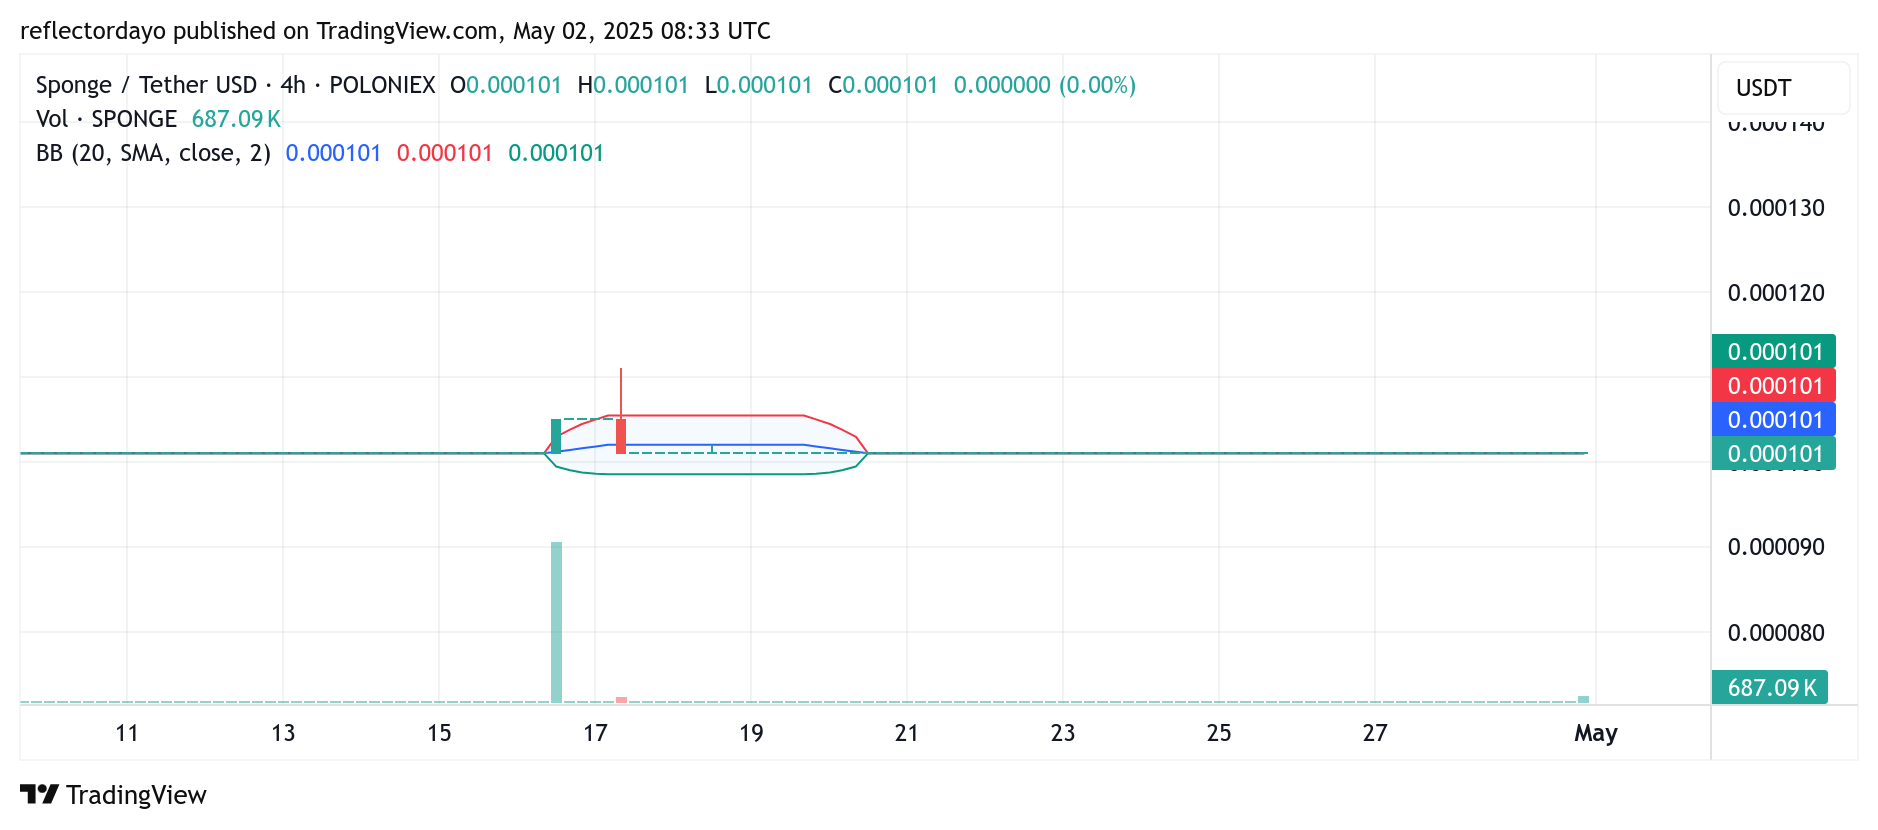
SPONGE/USD 4-Hour Chart Outlook: Volatility Squeeze Hints at Imminent Breakout
From the 4-hour chart perspective, SPONGE/USD appears to be entering a volatility squeeze, with the Bollinger Bands converging closely around a horizontally moving price. This tightening range often precedes a significant price movement.
Adding to this anticipation, the recent spike in the volume histogram suggests growing market interest, reinforcing the likelihood of a breakout. If this momentum builds, traders should be prepared for a potential upward move, with $0.00011 emerging as the next key target.
Buy SPONGE/USD!
HODLING through the noise pic.twitter.com/g7fN7pKX0l
— $SPONGE (@spongeoneth) April 28, 2025
Join the SPONGE community and get in on the next big crypto opportunity! Buy Sponge ($SPONGE) today