Sui (SUI/USD) Market Prepares for Renewed Upside Amid Technical Reaccumulation Phase
Estimated Reading Time: 3 minutes
Don’t invest unless you’re prepared to lose all the money you invest. This is a high-risk investment and you are unlikely to be protected if something goes wrong. Take 2 minutes to learn more

Sui Price Prediction — October 7
SUIUSD market prepares for renewed upside amid technical reaccumulation phase. SUIUSD currently exhibits a consolidative structure within a broader bullish framework, as indicators begin aligning for potential trend resumption.
The price remains marginally above the 9-day Simple Moving Average (SMA) positioned near $3.520, suggesting a gradual restoration of short-term buyer dominance. Simultaneously, the MACD histogram has crossed into positive territory with its signal line flattening, reflecting diminishing bearish momentum and early signs of directional recovery.
SUI/USD Market Key Levels:
Resistance levels: $3.8490, $4.3000, $5.3580
Support levels: $3.0670, $2.2940, $1.7160

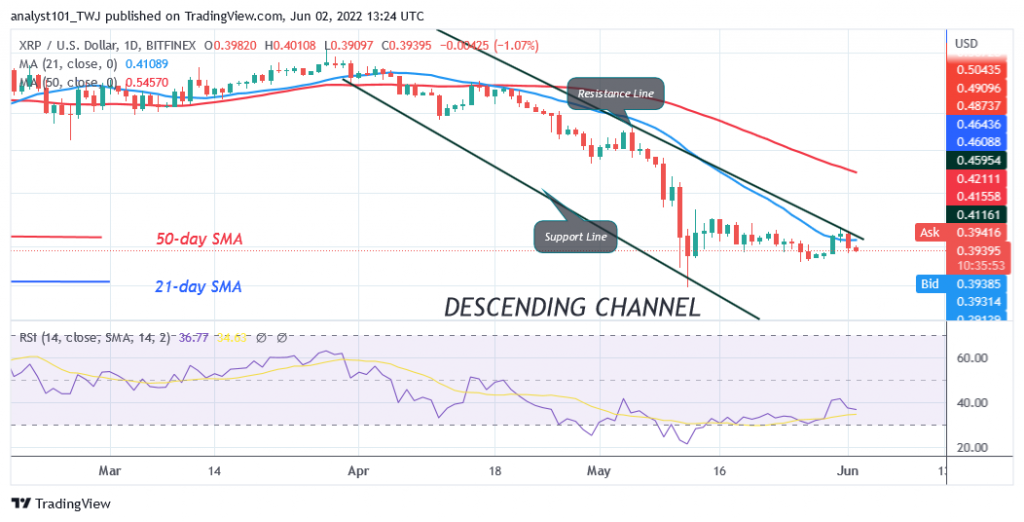
SUI/USD – Daily Chart
The SUI/USD daily chart shows a consolidation below the bullish trend.
From a technical perspective, price action has maintained support within the $3.070–$3.500 demand zone, marked by a recent order block that has historically fueled upward reversals. The pair continues to trade below a descending trendline resistance around $3.850, where price has encountered repeated rejections. Nonetheless, the steady formation of higher lows since mid-September indicates an emerging bullish structure, positioning the market for a potential breakout once overhead pressure eases.
Analysts Note A Strong Uptrend On Higher Timeframes
Keith Laye provides a detailed technical analysis of SUI, focusing on its current price trends and technical indicators primarily on the weekly and daily charts. The analyst notes a strong uptrend on the weekly timeframe, with the asset attempting to reclaim key moving averages (the 21, 50, and 200) simultaneously, which is a positive sign similar to another cryptocurrency, Cardano. On the daily chart, the coin appears to be performing better than Cardano, breaking above the 50 and 100 moving averages and bouncing off them cleanly, suggesting short-term strength. However, some challenges remain, such as a prevailing downtrend on the daily chart and the price still being within the Ichimoku cloud, which indicates indecision or resistance. The Ichimoku baseline and conversion lines are inverted, signaling that further improvement is needed before a sustained uptrend can be confirmed.
What is the projection for the SUIUSD market?
Looking ahead, a sustained move above $3.850 could confirm a trend reversal, paving the way for bullish continuation toward $4.180 and eventually $4.300. In the event of a short-term retracement, the $3.070 support zone is expected to attract renewed buying interest, reinforcing the broader recovery outlook. Overall, SUIUSD appears poised to resume its upward momentum once consolidation and retesting phases are complete.
Sui (SUI) Current Statistics
The current price: $3.6590
Market Capitalisation: $13,020,000
Trading Volume: $1,070,000,000
Place winning SUI trades with us. Get SUI here