The Gala v2 Market (GALA/USD) Tackles Early June’s Resistance Level
Estimated Reading Time: 3 minutes
Don’t invest unless you’re prepared to lose all the money you invest. This is a high-risk investment and you are unlikely to be protected if something goes wrong. Take 2 minutes to learn more
It appears that a substantial portion of participants in the GALA v2 market comprise long-term investors, as evident from the pronounced bullish movements. However, the daily trading sessions reflect a relatively modest trading volume. Despite this lower volume, the market has sustained notable bullish momentum since initiating its upward trend on October 21. Currently, the bull market is confronting resistance at the early June level of $0.03.
The Gala v2 Market Data
- GALA/USD Price Now: $0.02986
- GALA/USD Market Cap: $795,410,514
- GALA/USD Circulating Supply: 26,433,791,185 GALA
- GALA/USD Total Supply: 28,462,951,321 GALA
- GALA/USD CoinMarketCap Ranking: #71

Key Levels
- Resistance: $0.030, $0.035, and $0.040.
- Support: $0.025, $0.020, and $0.0150.
The Gala v2 Market Forecast: Analyzing the Indicators
On October 26, a significant surge in trading volume was observed, marking the sole spike amidst the ongoing progression of the bull market. Throughout the bullish trend, the trading volume did not consistently align with the strength of the upward momentum. However, upon reaching the $0.025 price level, a notable standoff occurred between bulls and bears. In today’s market, bullish pressure seems to have compelled bears to reconverge above the $0.030 price level, as exemplified by the formation of an inverted hammer in the current daily trading session. Despite the inverted hammer traditionally being a bearish signal, the prevailing bullish sentiment in the market suggests the potential for the bull market to persist.

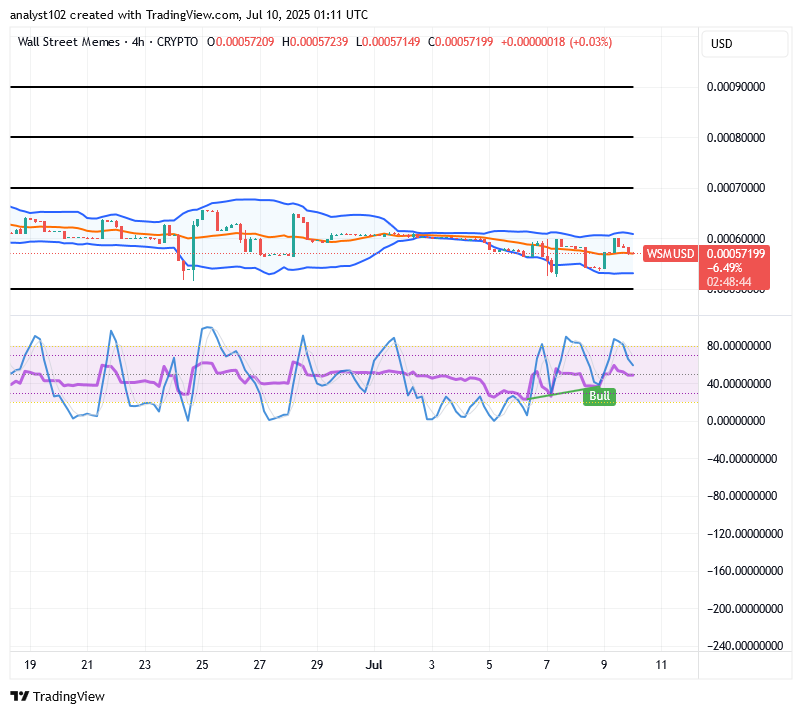
GALA/USD 4-Hour Chart Outlook
Bullish traders currently find themselves in a deadlock with bearish counterparts near the $0.030 price level, causing the market to stabilize at this point. There is a potential scenario where either a support level materializes or the bears manage to uphold the June 3 resistance, leading to a price retracement. However, an examination of the Bollinger Bands, illustrating an upward-moving price channel, and the Relative Strength Index, registering at a level of 65, suggests persistent bullish signals. These indications may contribute to the continuation of the bullish trend, maintaining an upward trajectory for the market.