Top Five Trending Coins for October 11: WFI, ASTER, BTC, ETH, and XRP
Estimated Reading Time: 5 minutes
Don’t invest unless you’re prepared to lose all the money you invest. This is a high-risk investment and you are unlikely to be protected if something goes wrong. Take 2 minutes to learn more

This week’s market analysis reveals a notable surge in volatility across the broader cryptocurrency market, likely driven by the sharp fluctuations in Bitcoin’s price. While the WeFi market experienced upward volatility, most other markets are facing downward pressure. Interestingly, both Bitcoin and Ethereum have reappeared on the trending list after a long absence—a sign of renewed investor attention.
Let’s take a closer look at how each market is performing.
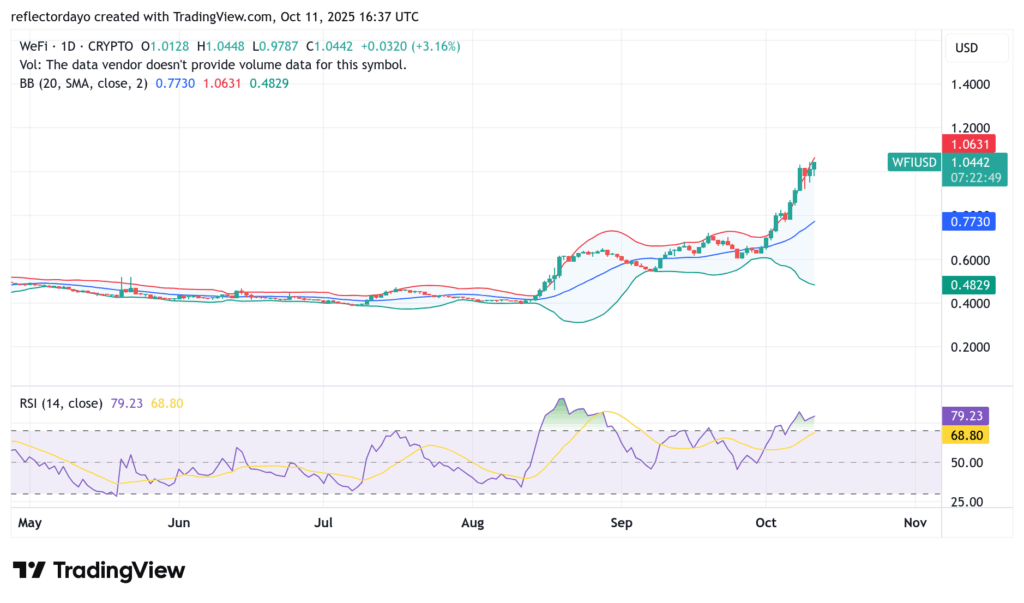
WeFi (WFI)
Major Bias: Bullish
The WeFi market witnessed a significant bullish breakout at the start of October, marked by strong and persistent upward momentum. This rally, however, has led to a sharp surge in volatility.
According to the Bollinger Bands indicator, the price range has expanded between $0.48 and $1.066—reflecting heightened market volatility. Meanwhile, the Relative Strength Index (RSI) currently stands at 79, signaling overbought conditions and suggesting that a correction may be imminent.
While the anticipated correction could be substantial, bullish traders are likely to find new support around the $0.80 level, where the market may attempt to stabilize before its next move.
Current Price: $1.0541
Market Capitalization: $72.8 million
Trading Volume: $4.7 million
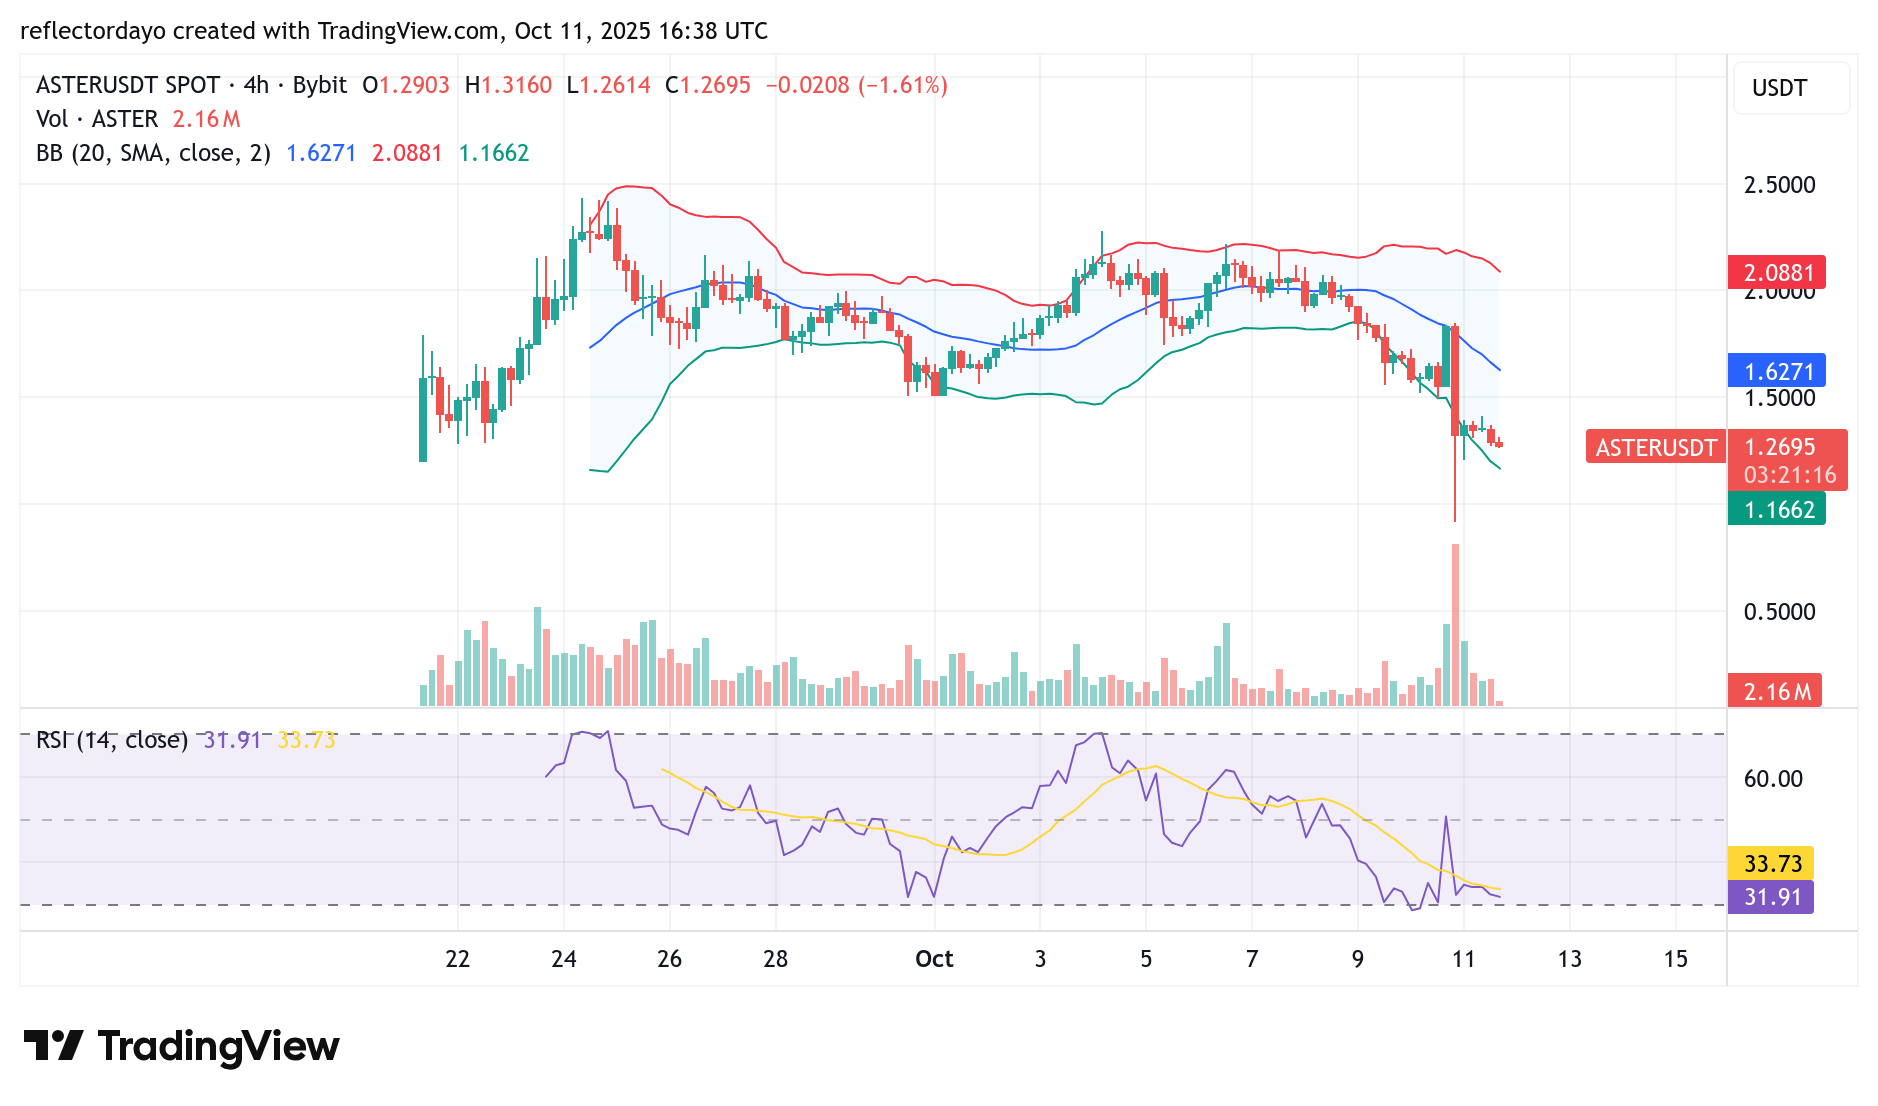
Aster (ASTER)
Major Bias: Bearish
The Aster market had been in a persistent downtrend until October 10, when selling pressure reached its peak. This sharp decline in the crypto signal drove the price down to the $0.88 level from around $1.80. However, opportunistic traders quickly took advantage of the dip, sparking a rebound that lifted the price to approximately $1.29.
The latest candlestick on the chart forms a plus-sign doji, indicating a standoff between buyers and sellers at this critical low. The market also appears to be in oversold territory, suggesting that bearish momentum may be fading. If this balance tilts in favor of the bulls, a potential rebound toward the $1.60 level could follow.
Current Price: $1.32
Market Capitalization: $2.25 billion
Trading Volume: $2.9 billion
Bitcoin (BTC)
Major Bias: Bearish
It has been a while since Bitcoin last appeared in our weekly trending market analysis, but this week, the volatility of the “King Coin” is impossible to ignore. Price action has fluctuated sharply within a range of $106,000 to $127,000 over just a few days. After dipping to a low of $106,000—an area that attracted strong bullish interest—the market rebounded to around $112,000.
Despite this recovery, bearish sentiment still dominates as the price remains below the $116,000 level, which aligns with the 20-day moving average. Nonetheless, given the heightened volatility, a sharp price swing could occur at any moment, potentially propelling Bitcoin back into the bullish zone.
Current Price: $116,023
Market Capitalization: $2.23 trillion
Trading Volume: $181.9 billion

Ethereum (ETH)
Major Bias: Bearish
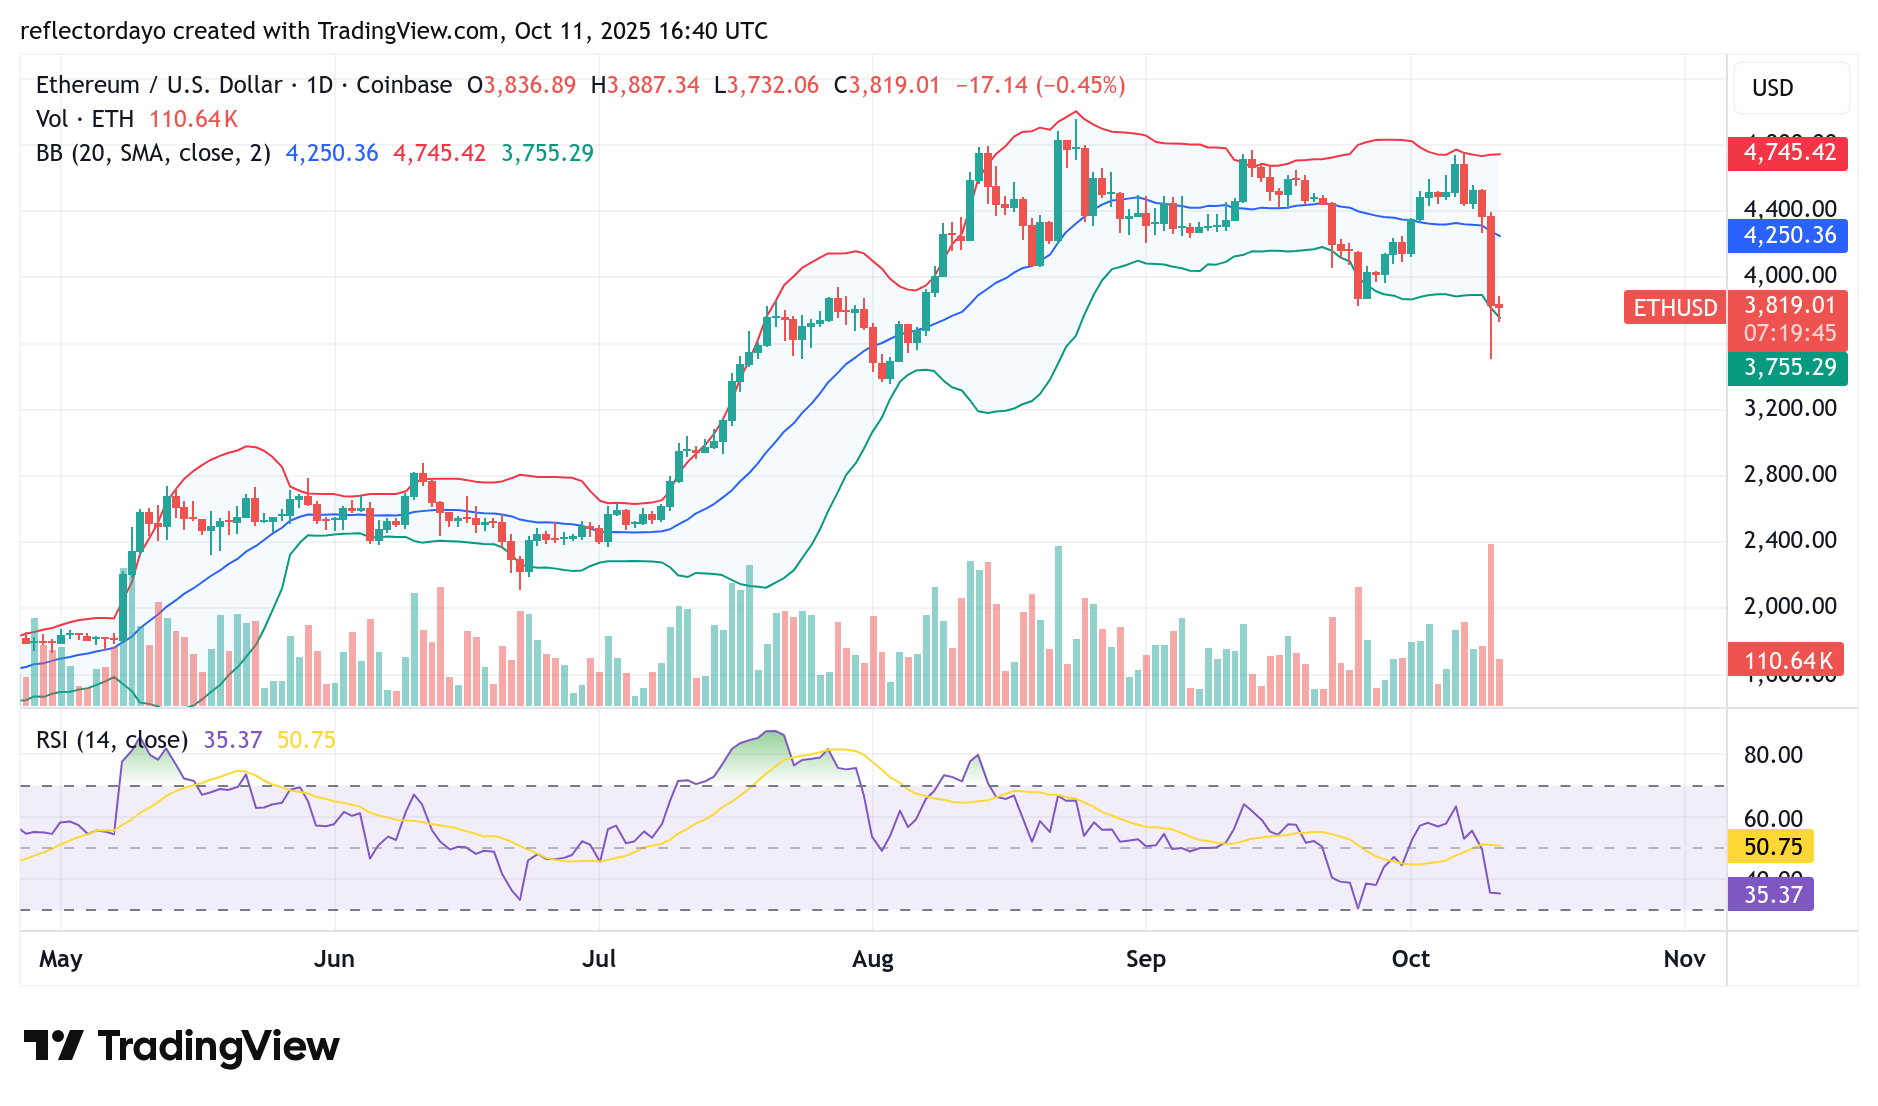
Another major market making its way into this week’s trending analysis is Ethereum (ETH/USD), once again moving in tandem with Bitcoin. On October 10, the Ethereum market experienced a sharp sell-off, marked by intense downward volatility. The trading volume histogram reflected this activity clearly, showing a massive spike accompanying the large bearish candlestick of the day.
Following this sell-off, a slight recovery occurred as traders took advantage of the dip around the $3,500 level. The market then stabilized near $3,824, represented by a doji candlestick—signaling indecision between buyers and sellers. Although Ethereum currently remains within the sell zone, technical indicators suggest the possibility of a short-term rally, with potential resistance near the $4,400 level.
Current Price: $3,821
Market Capitalization: $461.3 billion
Trading Volume: $105.6 billion
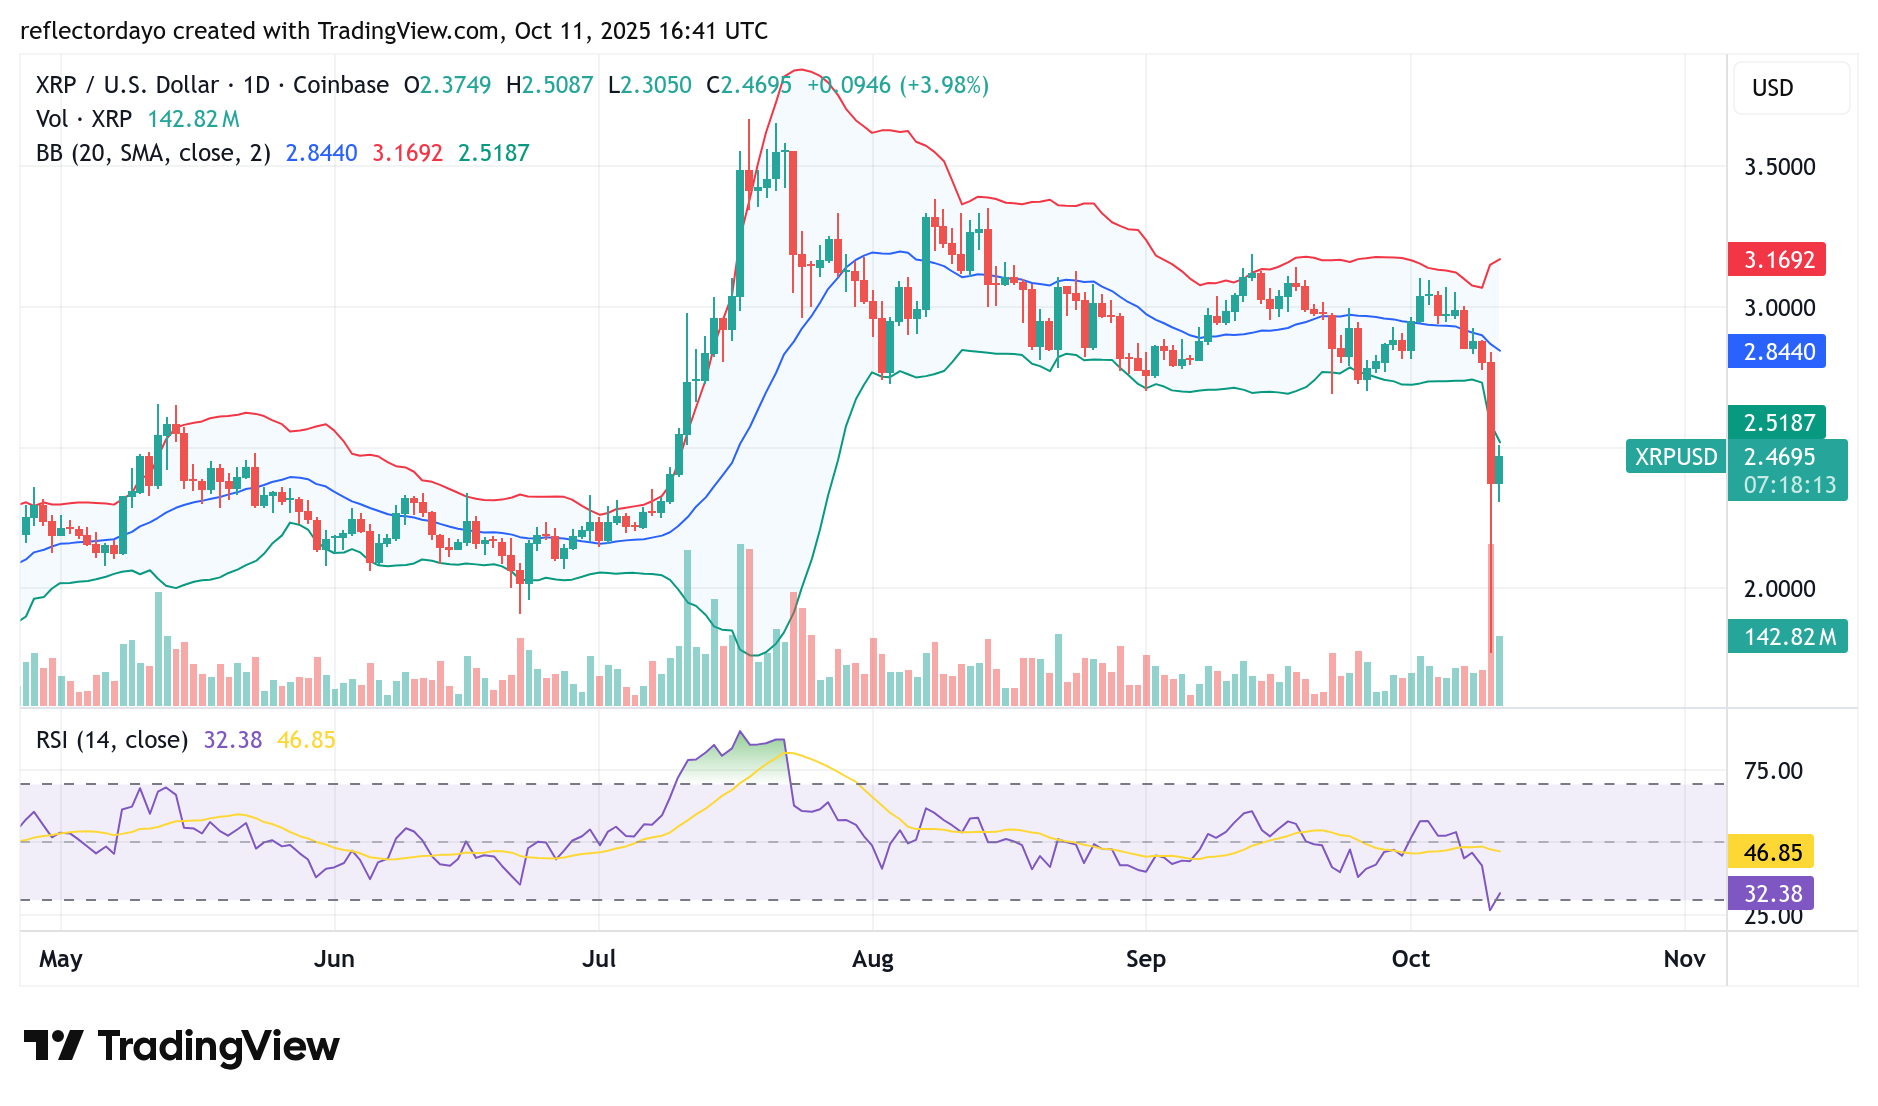
XRP (XRP
Major Bias: Bearish
The XRP/USD market mirrored Ethereum’s trading pattern this week, with October 10 marked by intense volatility and a sharp sell-off. The trading volume histogram confirmed this market activity, displaying a significant surge that reflected the heightened selling pressure.
During the session, XRP’s price fell sharply from around $2.90 to approximately $1.70 before bargain hunters stepped in to buy the dip. This buying activity has since driven a rebound, with the market now stabilizing near the $2.47 level.
Despite the prevailing bearish pressure, the market shows signs of a possible short-term correction. If momentum continues to build, XRP could rally toward the $3.00 resistance area in the coming sessions.
Current Price: $2.47
Market Capitalization: $148 billion
Trading Volume: $19.98 billion