UMA (UMAUSD) Continues Downward in Its Bearish Trend
Estimated Reading Time: 2 minutes
Don’t invest unless you’re prepared to lose all the money you invest. This is a high-risk investment and you are unlikely to be protected if something goes wrong. Take 2 minutes to learn more

Free Crypto Signals Channel
UMAUSD Analysis: The market continues to move downward in its bearish trend
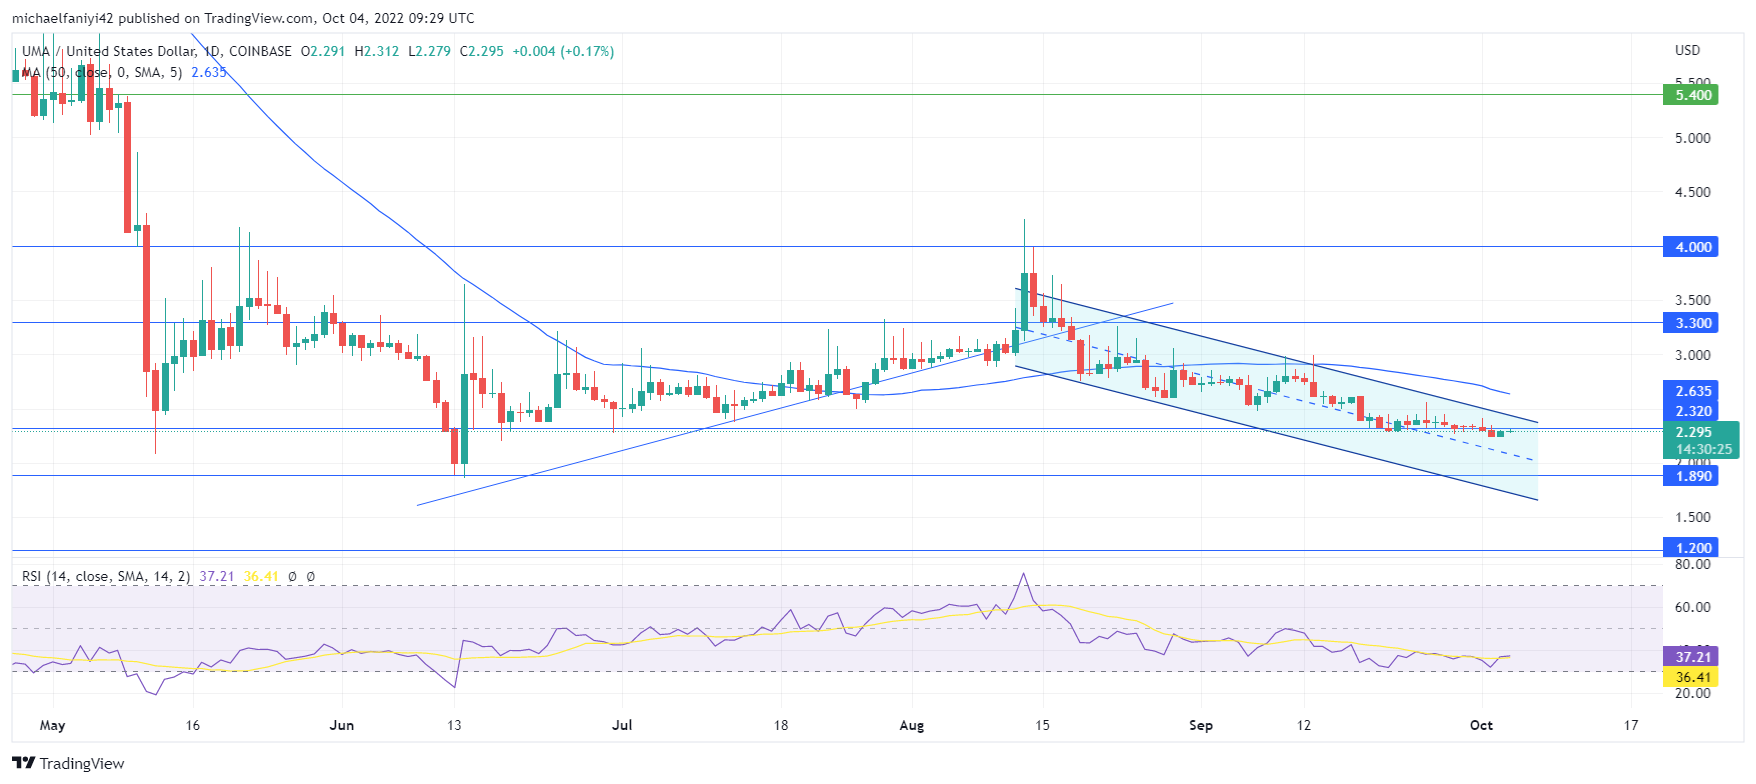
UMAUSD continues to decline in its bearish trend. The trend started when the market failed to breach the $4.000 key level. The rejection led to a dip in the price that plunged the market below $3.300 and down to $2.320. However, sellers have now taken the next step by pushing below the $2.320 key level. In general, the market is flowing downward through a parallel channel, and it continues.
UMAUSD Key Level
Supply Zone: $3.300, $4.000
Demand Zone: $1.890, $2.320
The sellers have more influence over the market. However, the bearish trend in the market was tempered at the $1.890 resistance level. From there, the buyers have been trying to push the price up, but the strain of the market is weighing heavily on the key level. The best attempt at UMAUSD occurs around the middle of August, when buyers gain significant momentum toward the $4,000 supply. Nevertheless, UMA was not able to get a handle on the price level and further sent it spiraling downward through a parallel channel.
The RSI (Relative Strength Index) line typifies the movement of the market in how it rises to a peak and drops immediately. The coin is now hovering over the border of the oversold region. The MA period 50 (Moving Average) also hanging above the market as a sign of bearishness.
Market Expectation
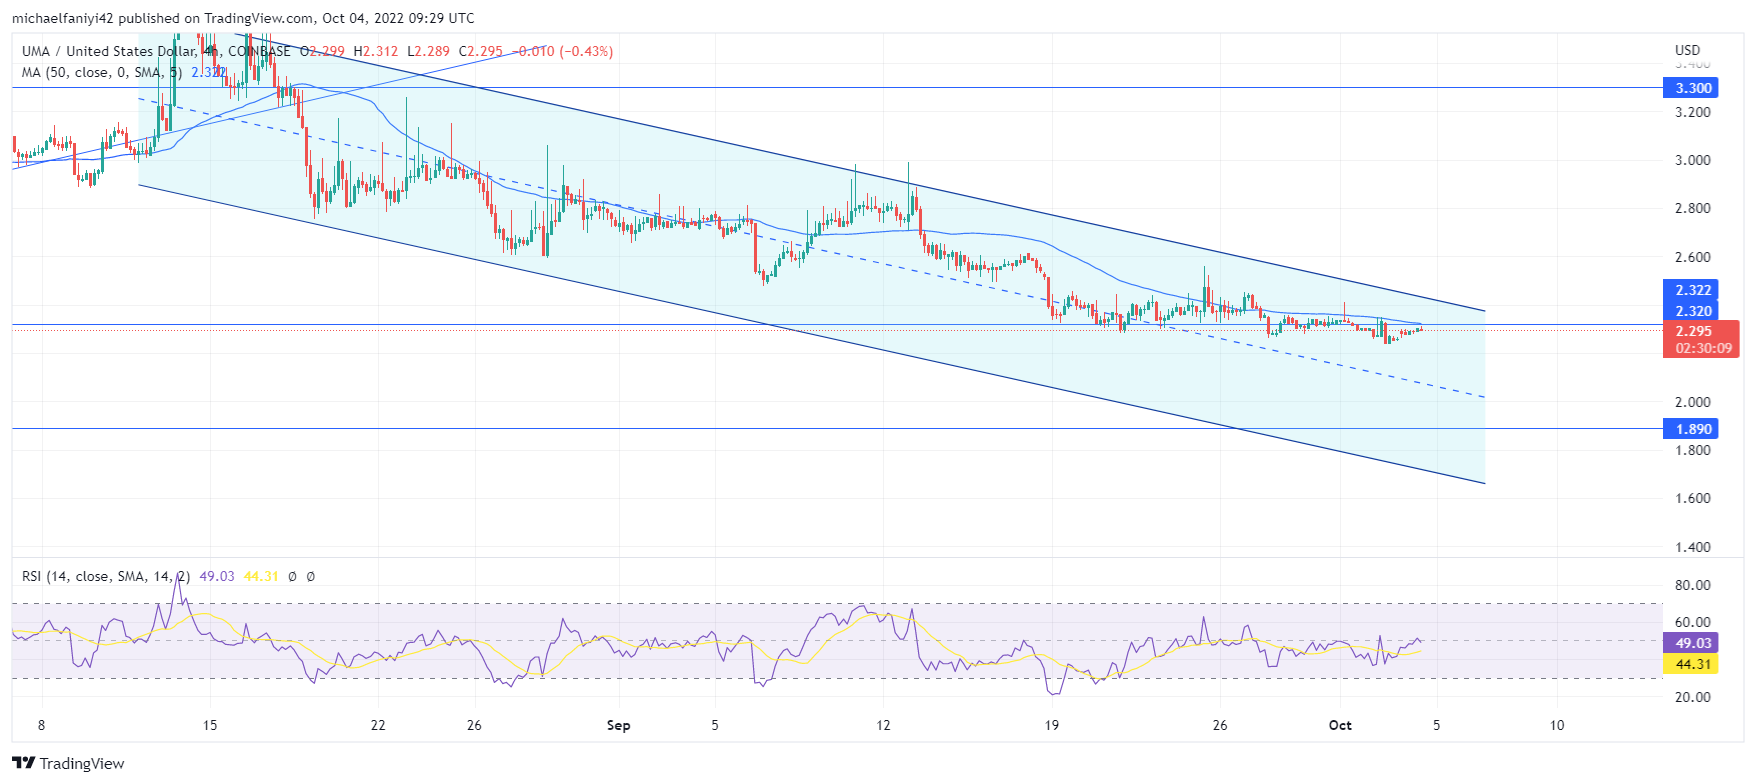
Even though the downtrend in the market was initially halted at $1.890, most activities were carried out at the $2.320 demand level. As the bearish pressure continues to weigh, UMA has taken a step below $2.320. This means that if things remain the same, the coin will start approaching $1.890 again. The RSI on the 4-hour chart, though somewhat moving sideways, is in the bearish half of the chart, and the MA period 50 remains above the candles.
You can purchase Lucky Block here. Buy LBLOCK
Note: Cryptosignals.org is not a financial advisor. Do your research before investing your funds in any financial asset or presented product or event. We are not responsible for your investing results.