Uniswap Price Prediction: UNI/USDT Market Continues to Lack Vigor
Estimated Reading Time: 3 minutes
Don’t invest unless you’re prepared to lose all the money you invest. This is a high-risk investment and you are unlikely to be protected if something goes wrong. Take 2 minutes to learn more

Uniswap Price Prediction (March 27)
The Uniswap token remains under pressure after its price action fell below the $7.00 level. The latest price candle on the chart suggests minimal buying activity, which does not support upward momentum. A more detailed analysis of the market is provided below.
UNI/USDT Long-Term Trend: Bearish (Daily Chart)
Key Price Levels:
Resistance: $7.00, $8.00, $9.00
Support: $6.00, $5.00, $4.00
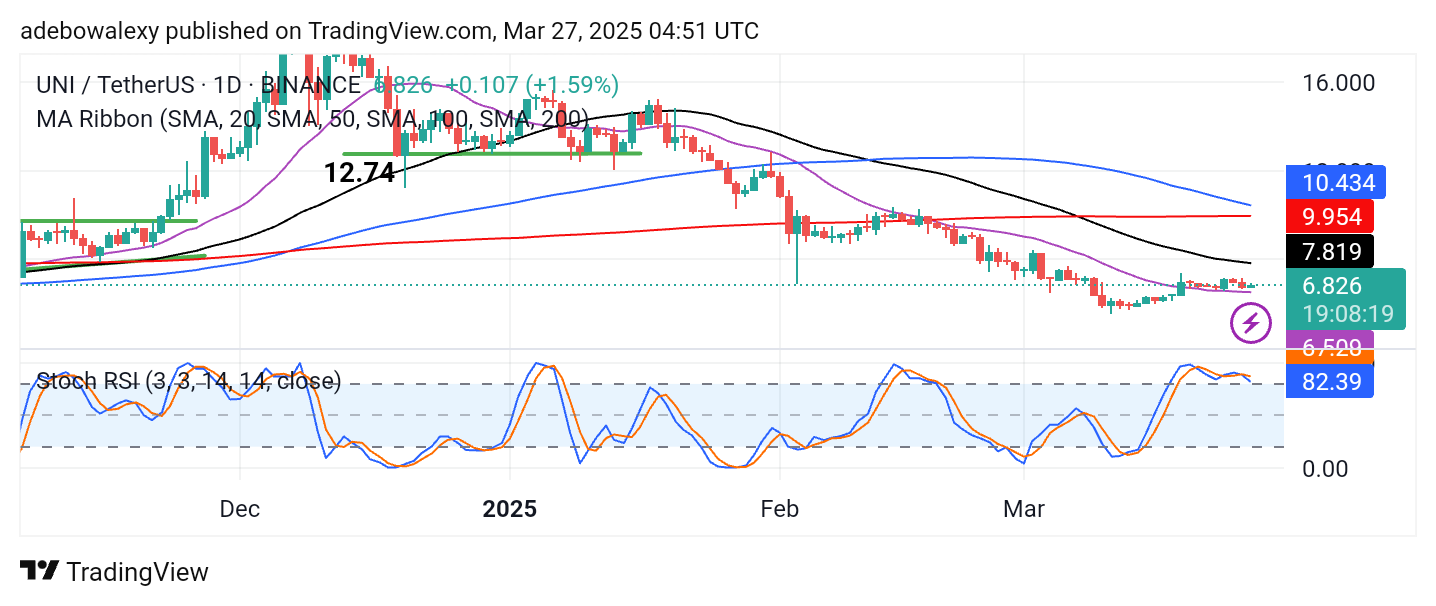
Price action in the Uniswap daily market continues to hover just above the 20-day Moving Average (MA) line. Meanwhile, the other MA lines remain above the price action on the daily chart. The price candle for the ongoing session is green but has a relatively small body. Furthermore, the Stochastic RSI lines have continued oscillating sideways above the 80 level of the indicator.
Uniswap Price Prediction: UNI/USDT Bulls Have a Solid Base but Lack Momentum
Trading activity in the Uniswap daily market has remained above the 20-day MA line for the past eight sessions. However, despite this, price action has failed to make significant upward progress. As a result, the market continues to hover above the 20-day MA line, awaiting a significant catalyst.
The ongoing session appears bullish but offers only marginal gains. Likewise, the Stochastic RSI lines are merely oscillating sideways in the overbought region of the indicator. Since the Stochastic RSI already signals overbought conditions, this suggests that the market needs a strong catalyst to revive bullish momentum.
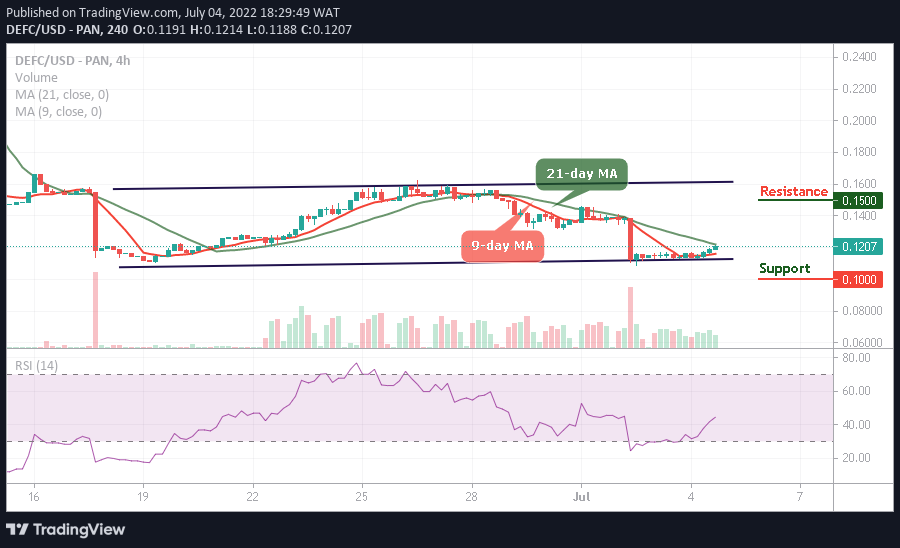
Uniswap Price Prediction: UNI/USDT Experiences a Minor Pullback (4-Hour Chart)
Observing the Uniswap daily chart, one can see that price action recently experienced a moderate upward rebound. However, this rebound appears to have encountered resistance at the 50-day MA line, causing a slight downward retracement in the ongoing session. Nevertheless, price activity continues to test the 50-day MA line.
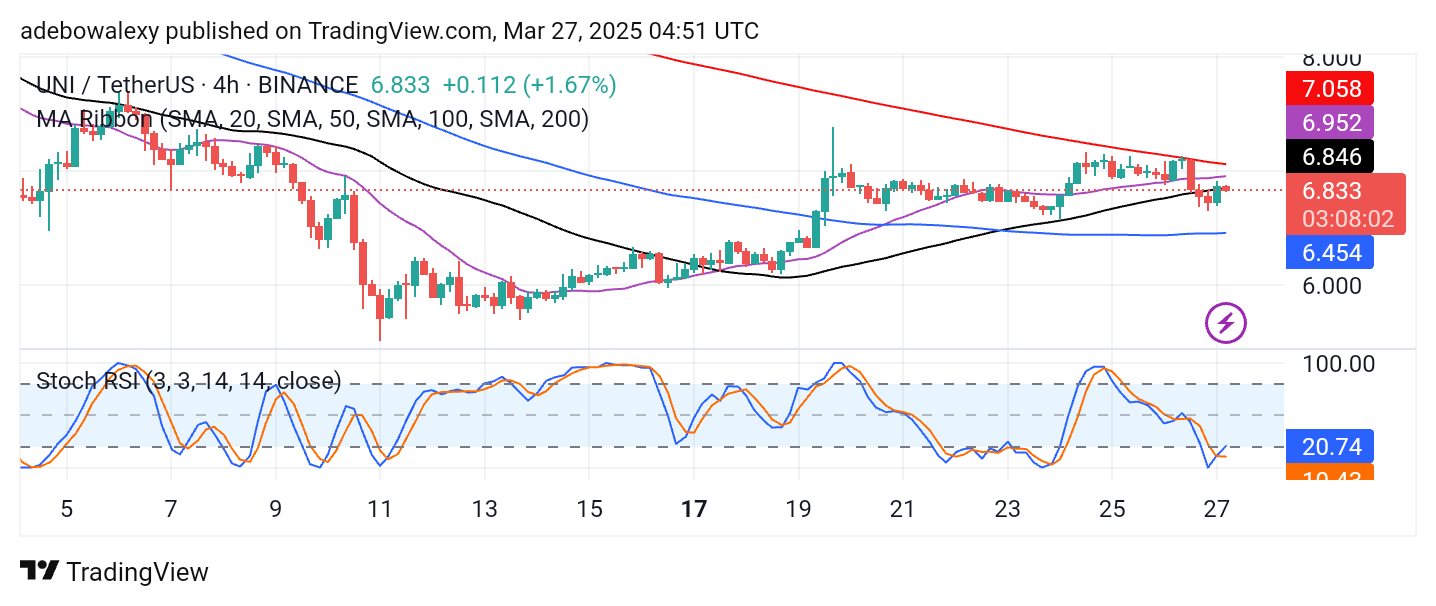
Additionally, the Stochastic RSI lines are rising from the oversold region following an upward crossover. The RSI lines appear consistent with this crossover, reinforcing the potential for further gains. Consequently, traders may look for a breakout above the $7.00 price.