Uniswap (UNI) Price Prediction: UNI/USDT Advances on Its Recovery Path
Estimated Reading Time: 3 minutes
Don’t invest unless you’re prepared to lose all the money you invest. This is a high-risk investment and you are unlikely to be protected if something goes wrong. Take 2 minutes to learn more

Date: October 2, 2025
Following a steep price dip in the Uniswap daily market, price action has reached rock bottom and rebounded positively. The upward recovery has been ongoing since the previous session. As a result, price action has managed to move past key technical levels, and it appears that more price increases may follow in this market.
UNI/USDT Long-Term Trend — Bullish (Daily Chart)
Key Price Levels
Resistance: $9.00, $10.00, $11.00
Support: $8.00, $7.00, $6.00
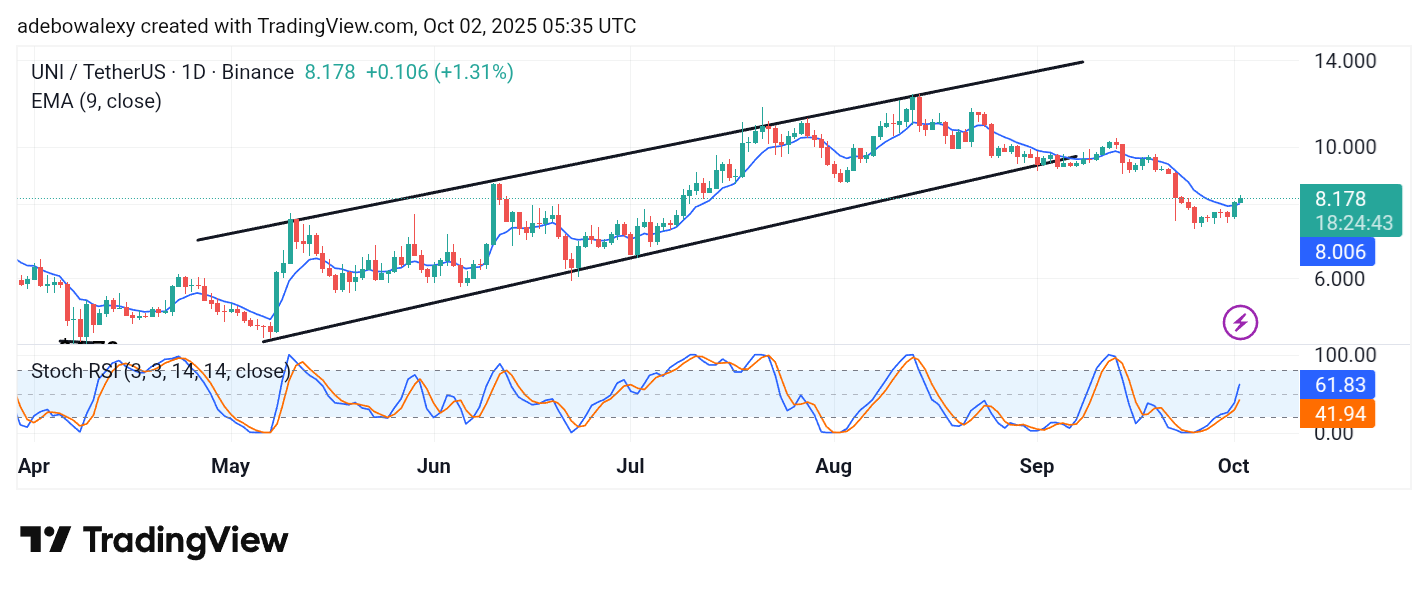
Bulls have stayed in the lead for the second consecutive session. As a result, Uniswap’s price action has moved above the 9-day Exponential Moving Average (EMA) line. The ongoing session is represented by a green candle. Meanwhile, the Stochastic Relative Strength Index (SRSI) indicator lines are rising steeply, which raises some concerns. The lead line is now above the 60 threshold, while the lagging line remains at 41.94.
Uniswap Price Prediction: UNI/USDT Upside Momentum Needs to Strengthen
The Uniswap market is experiencing an upside recovery, and price action has moved past the important 9-day EMA curve. The ongoing session has registered notable gains, keeping the token trading above the $8.00 level.
At the same time, the SRSI lines are rising towards the overbought region. The indicator’s movement suggests that the market remains volatile but tilted in a positive direction. This indicates that upside moves may occur rapidly. However, it is worth noting that the SRSI movement appears somewhat exaggerated, hinting that bullish momentum may weaken soon.
Uniswap Price Prediction: UNI/USDT Bulls Attempt to Maintain Control (4-Hour Chart)
Examining Uniswap’s price action on the 4-hour chart shows that bulls are trying to maintain control. Price candles have been green for the past six sessions, and the ongoing session continues to trade above the 9-day EMA curve.
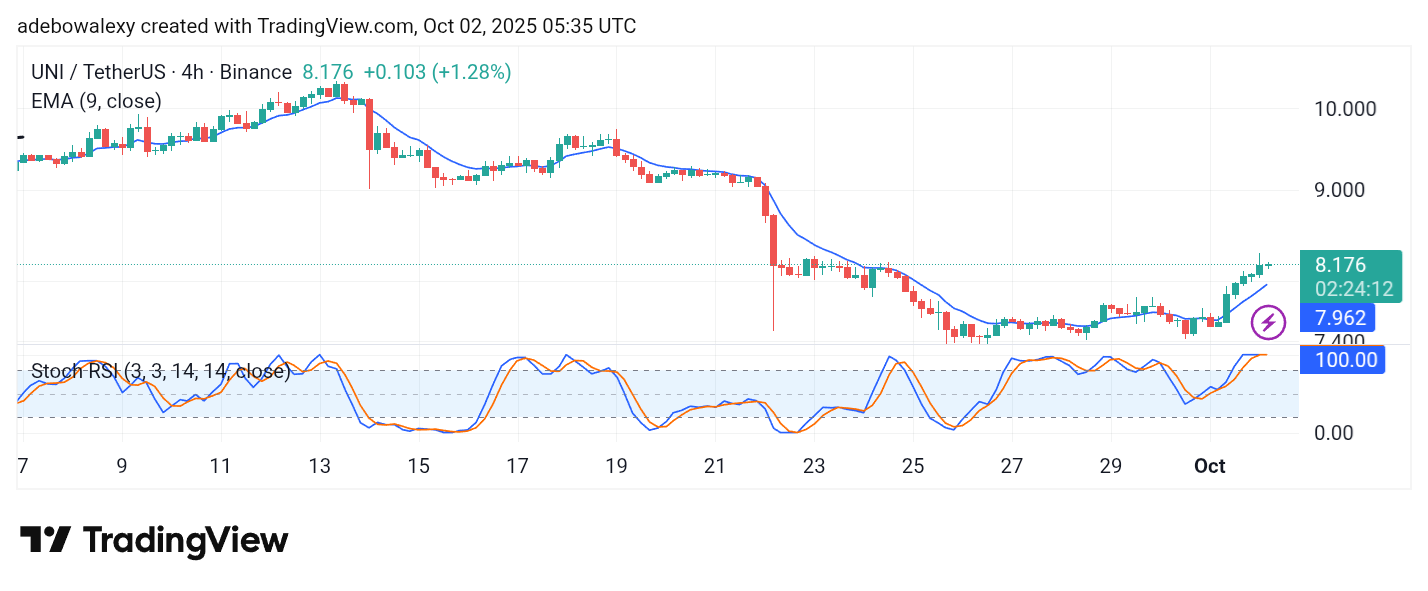
Meanwhile, the SRSI lines remain above the overbought region. The lines are merged and trending sideways around the 100 level, which technically affirms persistent upward pressure toward higher prices. However, considering the overbought condition, the $8.50 price level may be sufficient for short-term gains, with the next target at $9.00.