Uniswap (UNI) Price Prediction: UNI/USDT Faces Rejection at Resistance
Estimated Reading Time: 3 minutes
Don’t invest unless you’re prepared to lose all the money you invest. This is a high-risk investment and you are unlikely to be protected if something goes wrong. Take 2 minutes to learn more

Uniswap (UNI) Price Prediction: February 13
Price action in the Uniswap market has been moving slowly over the past session. Subsequently, price action has shifted downward as the market faces strong headwinds, as observed.
UNI/USDT Long-Term Trend: Bearish (Daily Chart)
Key Price Levels:
Resistance: $10.00, $15.00, $20.00
Support: $8.00, $6.00, $4.00
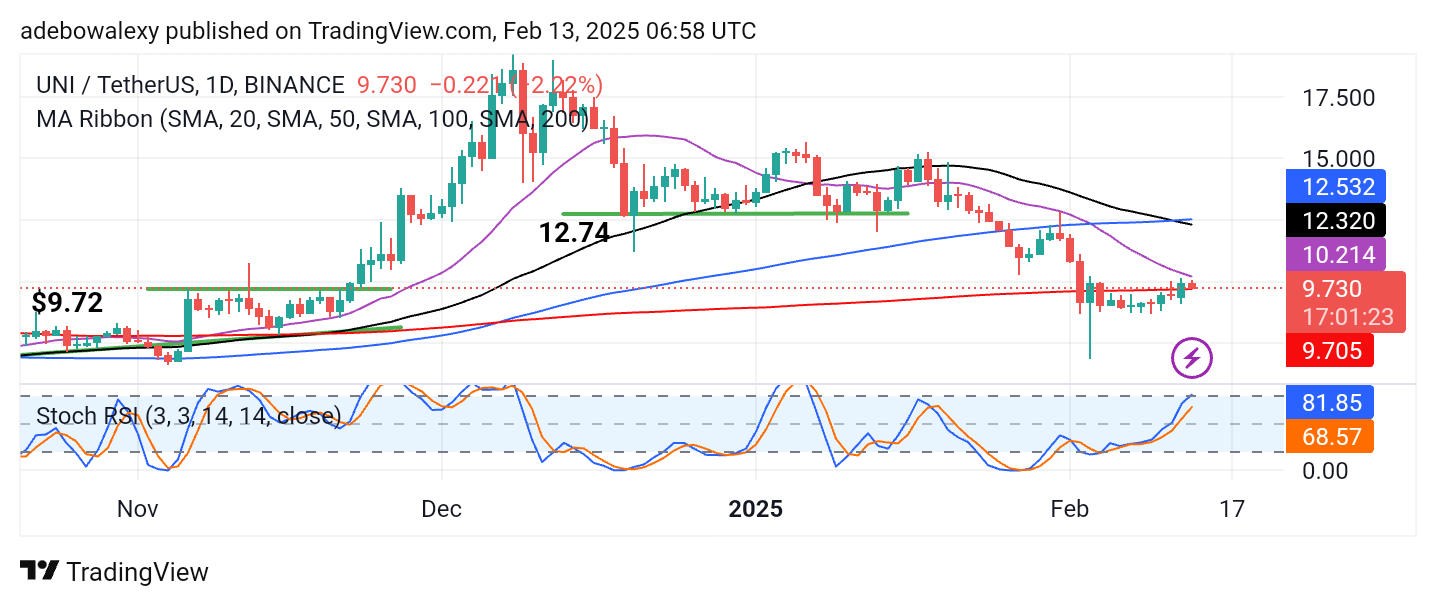
Price action made it past the 200-day Moving Average (MA) line but quickly fell back below the 20-day MA line. However, the ongoing session continues to hold above the 200-day MA curve. Additionally, the Stochastic Relative Strength Index (RSI) now shows a deflection on the lead line due to the moderate downward retracement in the ongoing session. The lead line of the indicator is currently at the 80 mark.
Uniswap (UNI) Price Prediction: UNI/USDT Hits Resistance at the 20-Day MA Curve
Price action in the Uniswap daily market has rebounded off the $10 price level in the ongoing session. The current session is represented by a red price candle, suggesting that price action has corrected off the resistance formed by the 20-day MA line. Additionally, the Stochastic RSI lines are still trending upward despite a slight deflection.
The fact that the RSI lines have now risen past the 80 threshold supports the likelihood that price action may still gain additional momentum. Nevertheless, the 20-day MA line remains a key resistance level. Therefore, traders should wait to see if price action breaches the 20-day MA line as resistance before making further decisions.
Uniswap (UNI) Price Prediction: UNI/USDT Upside Retracement Faces Threat (4-Hour Chart)
On the Uniswap 4-hour chart, price action has moved above two out of the four MA lines. This indicates that the token trades above the 20-day and 50-day MA lines. However, the 100-day MA line has formed resistance above the current price action. The Stochastic RSI lines converge sideways just above the 50 threshold on the indicator.
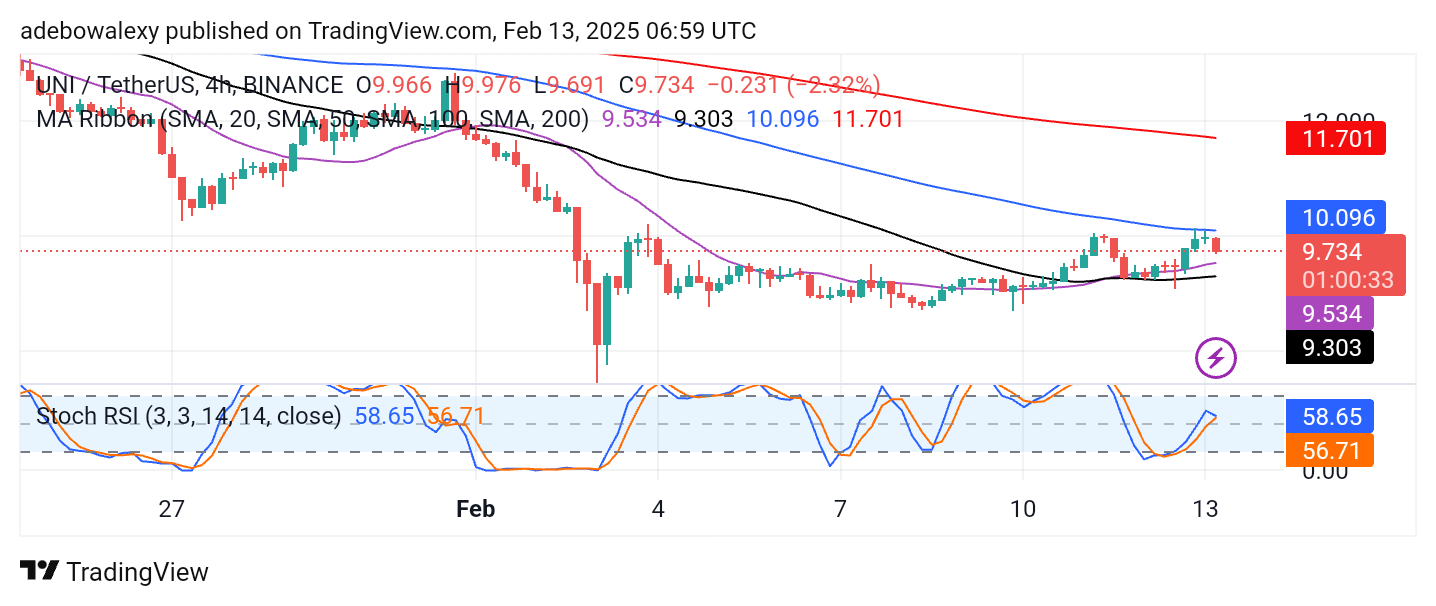
Given this, price action has the potential to move downward, as it has encountered strong resistance at the $10 threshold. The last price candle has pushed the market back to the opening level of the previous session. Additionally, the convergence of the Stochastic RSI lines suggests that price action may decline toward the $9.00 mark. Consequently, this market seems to be facing imminent threat at this price ceiling.