Uniswap (UNI) Price Prediction: UNI/USDT Heads Toward $8.00 Mark
Estimated Reading Time: 2 minutes
Don’t invest unless you’re prepared to lose all the money you invest. This is a high-risk investment and you are unlikely to be protected if something goes wrong. Take 2 minutes to learn more
Uniswap (UNI) Price Prediction: June 26, 2025
The Uniswap market has continued on its upward path since the most recent significant rebound. The current price candle on the token’s daily chart occupies a higher level, hinting that further price increases may follow. Let’s dive deeper.
UNI/USDT Long-Term Trend: Bearish (Daily Chart)
Key Price Levels:
Resistance: $8.00, $9.00, $10.00
Support: $7.00, $6.00, $5.00
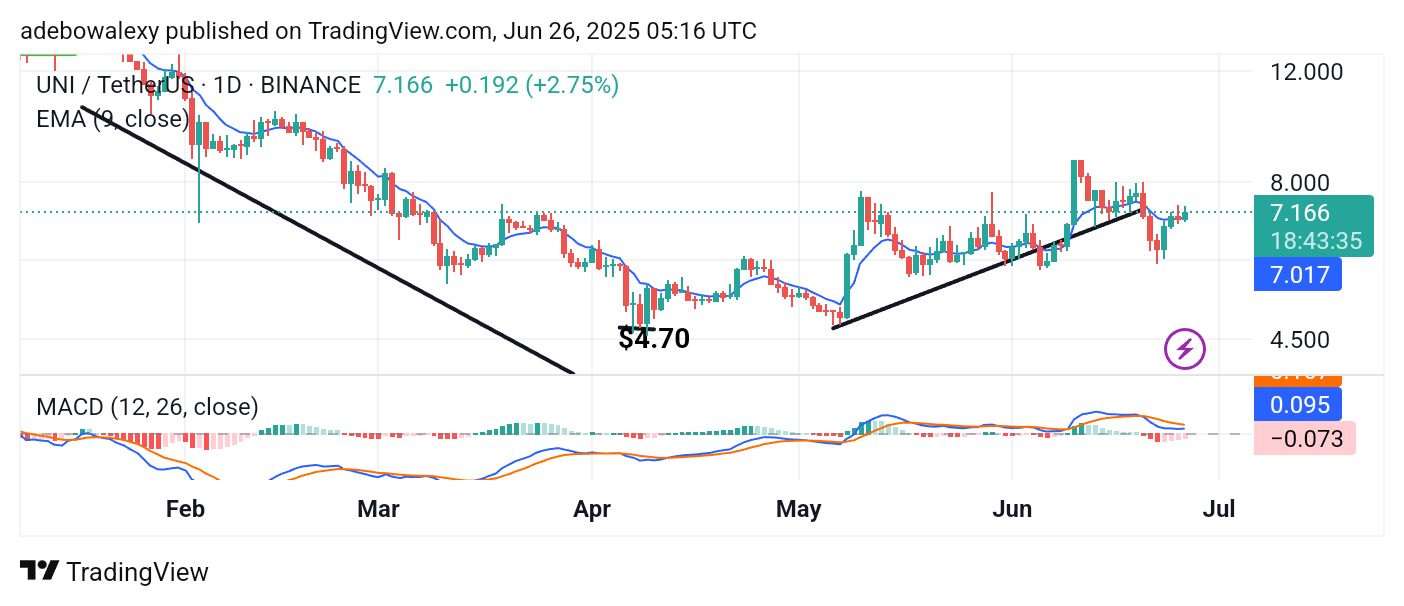
Price activity on the Uniswap daily chart has moved past the 9-day Exponential Moving Average (EMA) line. The current session’s price candle is green and stands above the EMA curve. Meanwhile, the lines of the Moving Average Convergence Divergence (MACD) indicator are bending upward above the equilibrium level. Also, the bars of the MACD histogram are now pale red, positioned just below the equilibrium level, indicating weakening bearish momentum.
Uniswap (UNI) Price Prediction: UNI/USDT Has a Solid Position
The Uniswap market has maintained a generally bullish stance since rebounding off support at the $6.00 level. Currently, price action has risen above the 9-day EMA line. This position suggests that the market maintains an upward trajectory.
The MACD lines are shifting toward an upward direction, and the histogram bars indicate that downward pressure is minimal. Consequently, a bullish crossover may soon occur, reinforcing the potential for continued gains.
Uniswap (UNI) Price Prediction: UNI/USDT Upside Retracement Holds (4-Hour Chart)
On the 4-hour chart, Uniswap’s price action has experienced a slight pullback but remains above the 9-day EMA line. The current candle is still positioned above the EMA, showing resilience.
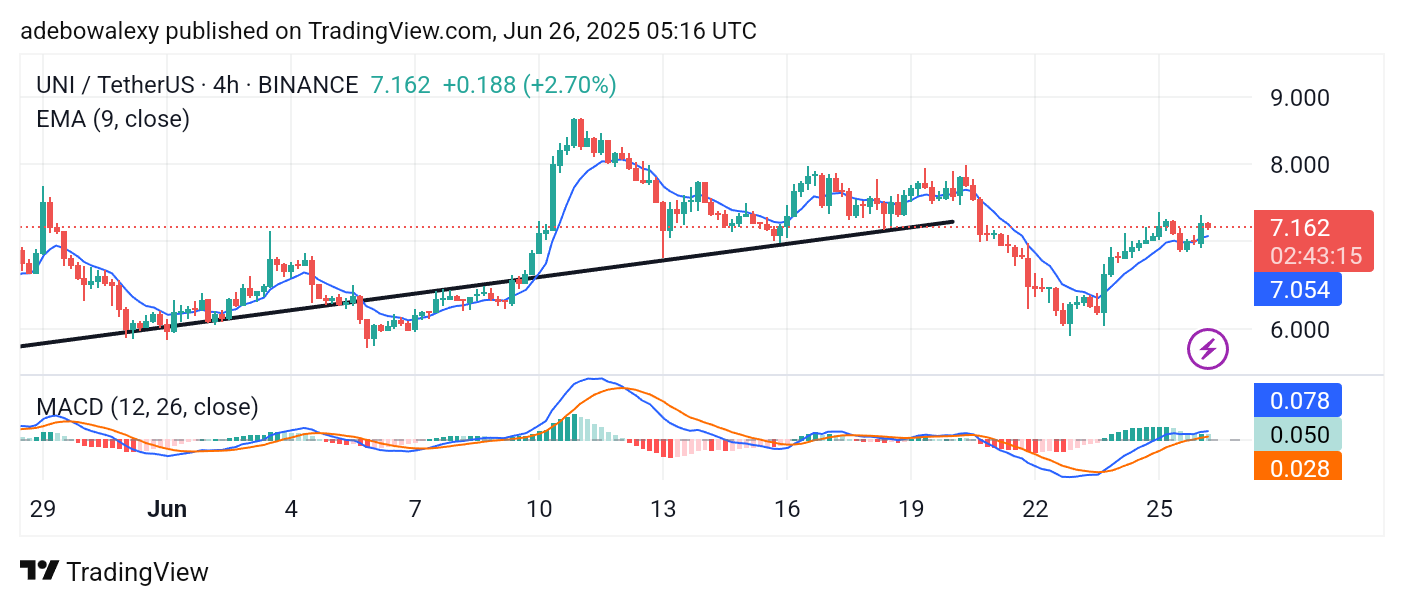
The MACD lines continue their upward movement despite the minor rejection in the current session. Likewise, the MACD histogram bars remain above the equilibrium level. In the short term, traders may target the $7.50 level and possibly $8.00 if momentum persists.