Bitcoin (BTC) Price Prediction: BTC/USDT Continues Its Upside Recovery
Estimated Reading Time: 2 minutes
Don’t invest unless you’re prepared to lose all the money you invest. This is a high-risk investment and you are unlikely to be protected if something goes wrong. Take 2 minutes to learn more

Bitcoin (BTC) Price Prediction: June 25, 2025
The Bitcoin market has continued its upward recovery ever since its price dipped below the $100,000 level. However, momentum seems to have decreased, judging by the look of the price candles, though the trend continues. Let’s take a deeper look at the market below.
BTC/USDT Long-Term Trend: Bearish (Daily Chart)
Key Price Levels:
Resistance: $110,000, $112,500, $115,000
Support: $105,000, $102,500, $100,000
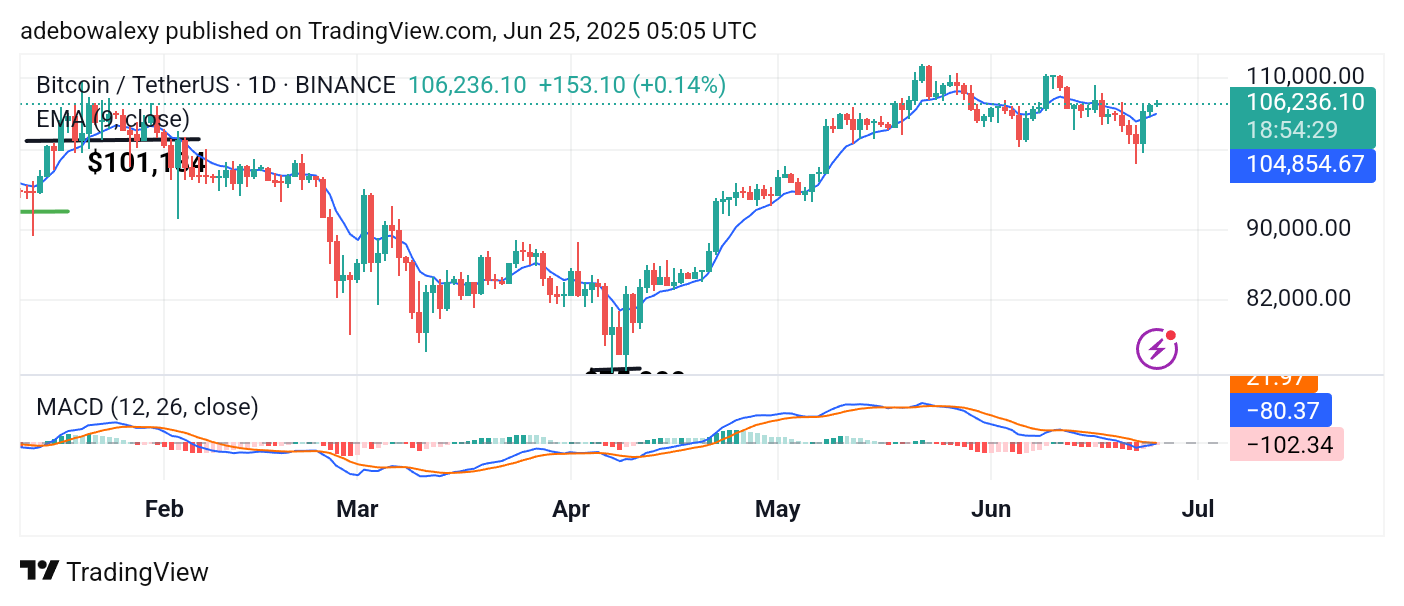
On the Bitcoin daily chart, price action has continued in the green. The ongoing session remains positive and stays well above the 9-day Exponential Moving Average (EMA) line. Also, the Moving Average Convergence Divergence (MACD) lines are converging at the indicator’s equilibrium level. The bars of the MACD indicator have disappeared at the point of convergence, as the indicator lines approach a crossover.
Bitcoin (BTC) Price Prediction: BTC/USDT Upside Momentum Dwindles
In the Bitcoin daily chart, price action appears to be experiencing a decline in upside momentum. Although the last three price candles are green, there has been a notable reduction in their size.
Nevertheless, the ongoing session remains in the green above the 9-day EMA line. Likewise, the MACD indicator lines are converging, signaling a potential upward crossover at the equilibrium level. Consequently, while upside momentum seems to be dwindling, the market may regain traction in the near term.
Bitcoin (BTC) Price Prediction: BTC/USDT Buyers Remain Persistent (4-Hour Chart)
The Bitcoin 4-hour chart shows that buying activity remains persistent. This is evident from the appearance of green price candles above the 9-day EMA line, consistent with previous sessions. The latest price candle also remains green and above the EMA line.
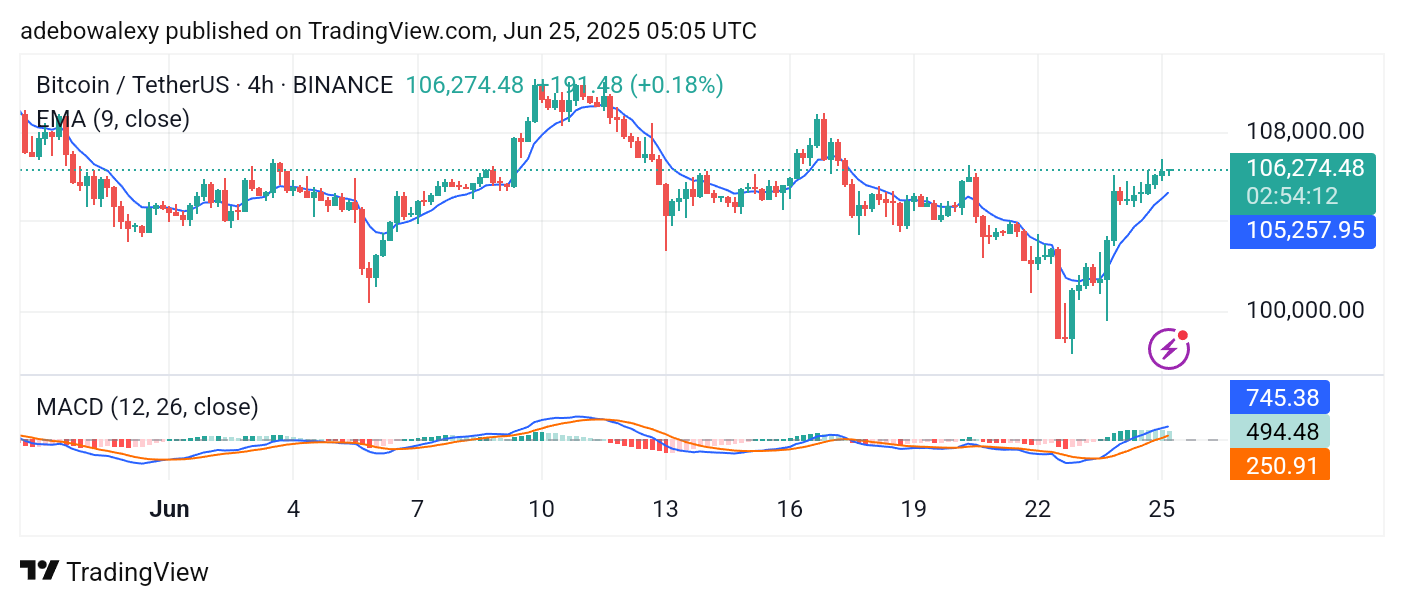
Additionally, the lines of the MACD indicator have just crossed above the equilibrium level, with pale green bars now appearing above it. Technically, upside forces remain intact and may continue to gain strength. Therefore, traders may target the $110,000 price level.