Litecoin (LTC) Price Prediction: LTC/USDT Rebounds Off the $80 Mark
Estimated Reading Time: 2 minutes
Don’t invest unless you’re prepared to lose all the money you invest. This is a high-risk investment and you are unlikely to be protected if something goes wrong. Take 2 minutes to learn more

Litecoin (LTC) Price Prediction—June 24, 2025
The Litecoin market saw a strong rebound off the $80 price level following the general market slump that occurred when Bitcoin crashed below the $100K baseline on Sunday. More details about the Litecoin market are provided below.
LTC/USDT Long-Term Trend: Bearish (Daily Chart)
Key Price Levels:
Resistance: $90, $95, $100
Support: $80, $75, $70
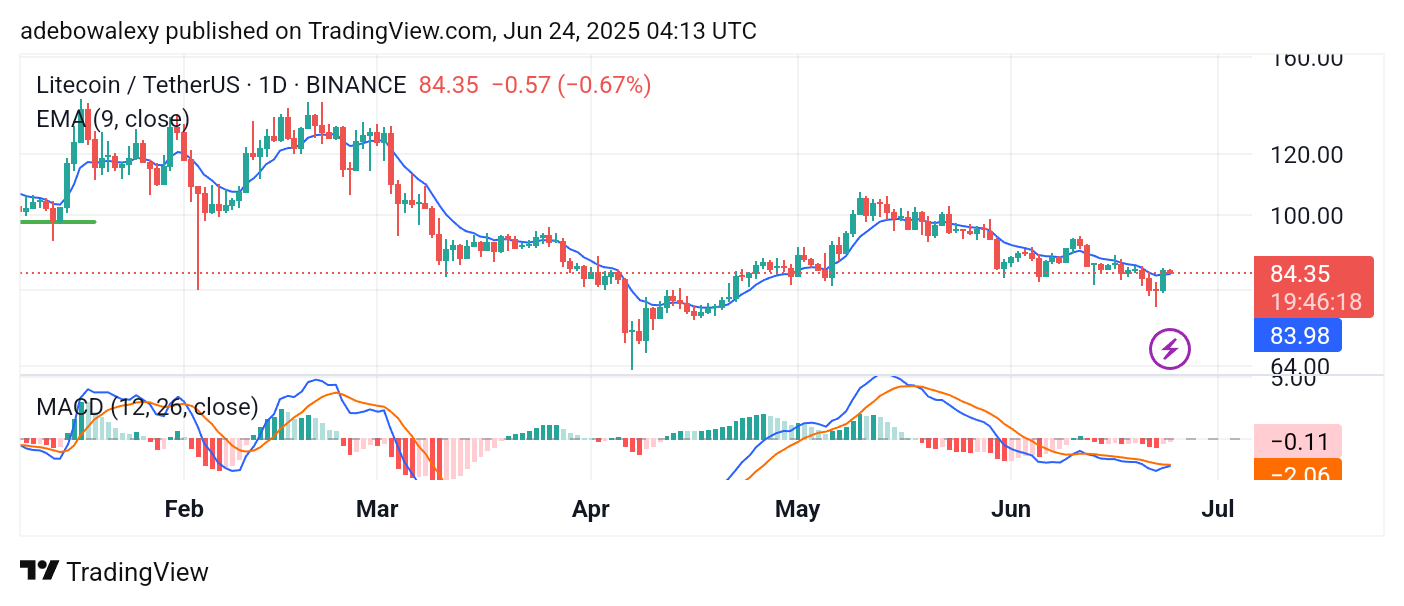
The ongoing session on the Litecoin daily chart is occurring above the 9-day Exponential Moving Average (EMA) line. However, the current price candle is red. At the same time, the Moving Average Convergence Divergence (MACD) indicator lines can be seen converging below the equilibrium level. It is worth noting, though, that the ends of the MACD lines are relatively flat rather than sharply converging.
Litecoin (LTC) Price Prediction: LTC/USDT Stays Poised for More Upside Moves
The Litecoin market remains largely bullish from a technical standpoint, despite the appearance of the latest price candle. In fact, this candle has its base above the 9-day EMA line, indicating that the market remains well-positioned for further upside retracement.
Additionally, the MACD indicator lines appear to be trending toward a bullish crossover below the equilibrium level. However, traders may wish to wait for further confirmation before adopting a more bullish stance in this market.
Litecoin (LTC) Price Prediction: LTC/USDT Upside Retracement Appears Protected (4-Hour Chart)
A review of the 4-hour chart shows that bullish sentiment in the short term appears to be holding strong. Price action has climbed significantly above the 9-day EMA line. Although the last two candles are bearish, they only reflect minimal downward retracement.
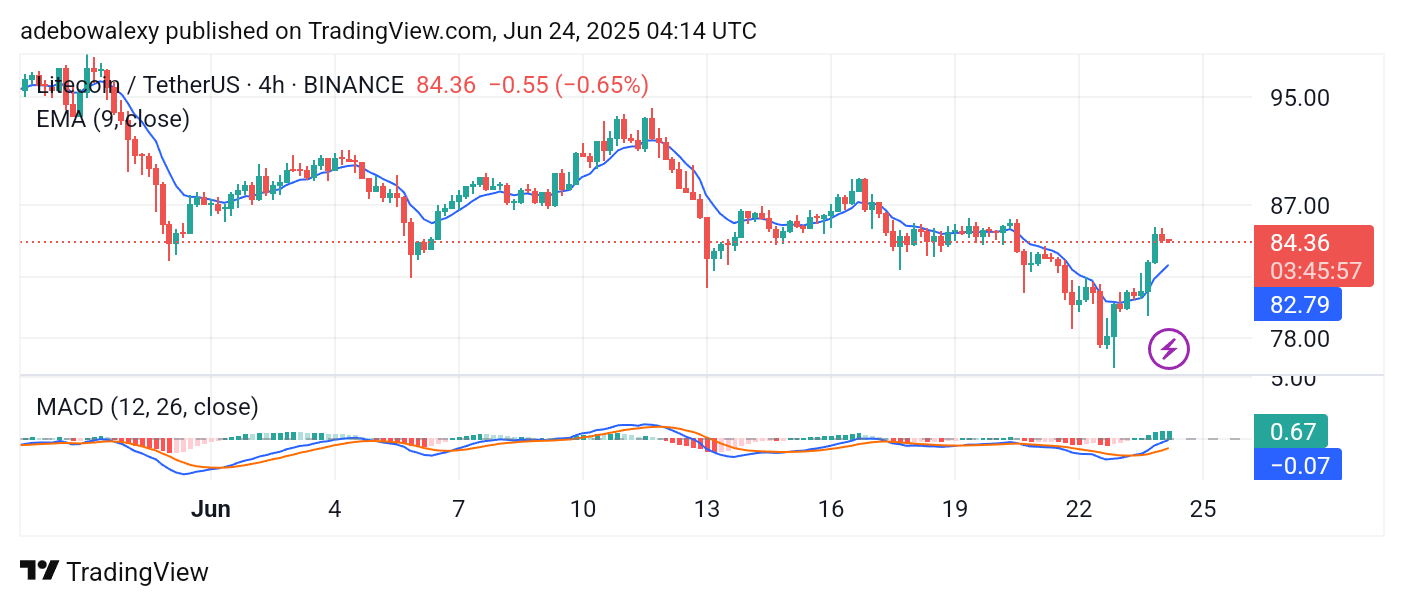
Furthermore, the MACD indicator lines on this chart are rising steadily from below the equilibrium level. Likewise, the histogram bars remain solid green, signaling strong bullish momentum. As a result, price action may still breach the resistance at the $87.00 mark and potentially challenge the $90 level as well.