XRP Slumps as It Revisits the Critical Support at $0.48
Estimated Reading Time: 2 minutes
Don’t invest unless you’re prepared to lose all the money you invest. This is a high-risk investment and you are unlikely to be protected if something goes wrong. Take 2 minutes to learn more
XRP (XRP) Long-Term Analysis: Bearish
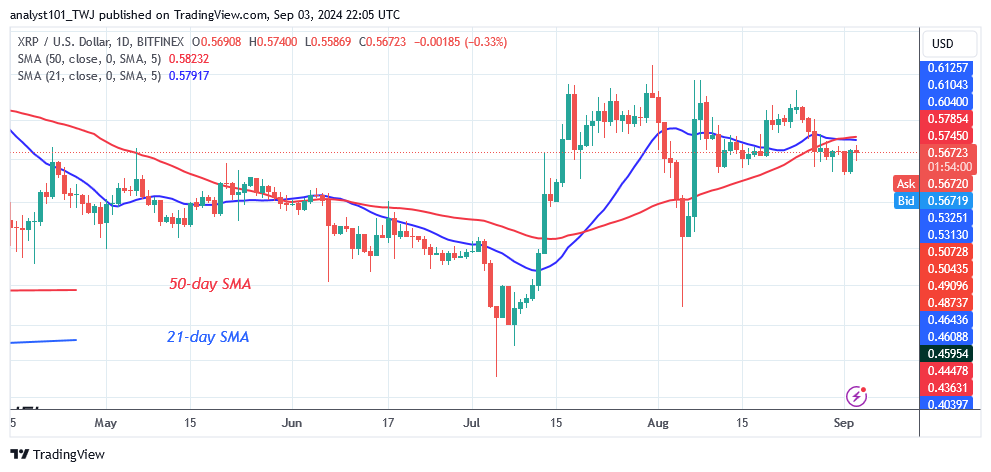
The XRP (XRP) price is in a sideways trend as it revisits the critical support at $0.48. The altcoin has remained range-bound, trading between the $0.48 support and the $0.64 resistance. On August 24, XRP was repelled at the $0.64 resistance zone, causing it to fall below the moving averages. The altcoin fell to a low of above $0.54. XRP is trading above the present support but below the moving average lines.
If the present support is breached, the altcoin will fall to the next support level of $0.48. However, if buyers retain the price above the moving average lines, the altcoin will restart its positive trajectory. Currently, the altcoin is still trading below the moving average lines.
Technical Indicators:
Major Resistance Levels – $1.00, $1.50, $2.00
Major Support Levels – $0.50, $0.30, $0.10
XRP (XRP) Indicator Analysis
The XRP price bars are bouncing below the moving average lines. The existence of Doji candlesticks has caused price movement to remain stationary. The moving averages are sloping horizontally, with a bearish crossover. The 21-day SMA is below the 50-day SMA, indicating a bearish trend.
What Is the Next Direction for XRP (XRP)?
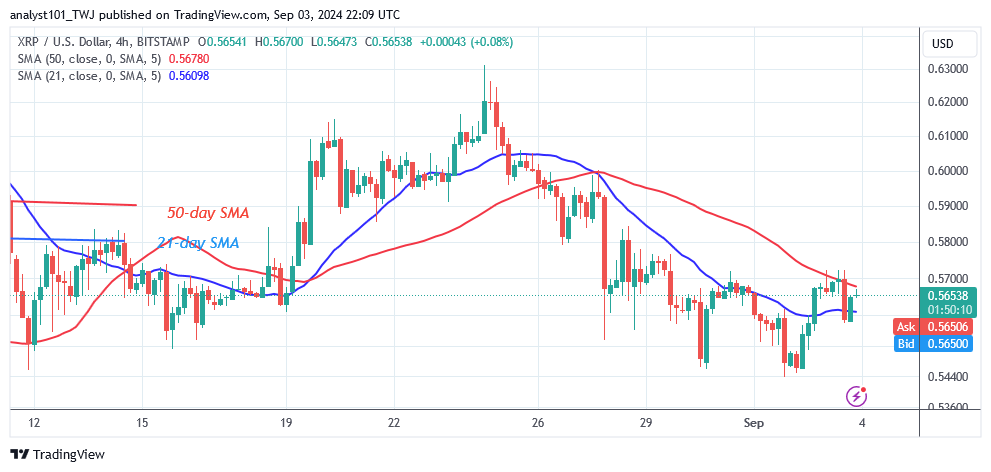
XRP is range-bound and trading below the moving average lines as it revisits the critical support at $0.48. The altcoin has found support above the $0.54 level. When the current support level of $0.54 is breached, the altcoin will continue to drop. Meanwhile, the crypto signal is negative, with the altcoin trading in the bearish trend zone.
You can purchase crypto coins here. Buy LBLOCK
Note: Cryptosignals.org is not a financial advisor. Do your research before investing your funds in any financial asset or presented product or event. We are not responsible for your investing results.