XRP (XRP/USDT) Consolidates Within a Tight Spot: What’s Next?
Estimated Reading Time: 3 minutes
Don’t invest unless you’re prepared to lose all the money you invest. This is a high-risk investment and you are unlikely to be protected if something goes wrong. Take 2 minutes to learn more
XRP Mid-term Analysis: Ranging
The market for XRP against Tether in recent times has exhibited a mix of volatile and bullish recovery. However, the pair appears to be pulling back after moving close to $3.100, indicating the potential for further consolidation or continuation on the weekly timeframe.
Recently, XRP has seen strong bullish movement, driven by the breakout above $3.000 this year. However, momentum has slowed down since hitting a resistance around $3.100, suggesting a pause or further correction.
To this end, the MACD and Guppy Multiple Moving Averages (GMMAs) show a positive trend ahead, but caution is warranted.
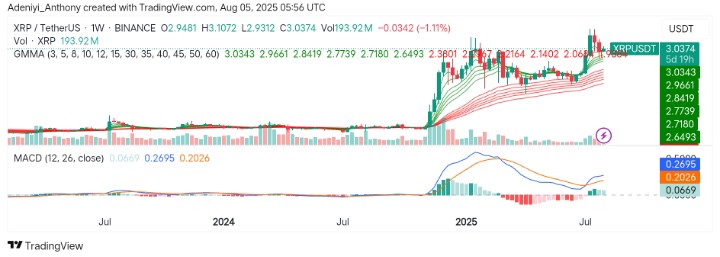
Currently, XRP trades at $3.0374 with over 193 million traded volumes for the week.
Technical Indicators
Major Resistance Levels: $3.100, $3.200, and $3.500
Major Support Levels: $2.940, $2.770, and $2.640
XRP Technical Analysis
On the weekly timeframe, the analysis for XRP against Tether remains bullish, as the price is holding above the long-term moving averages of the GMMA; the recent pullback suggests a moment of indecision.
The MACD, on the other hand, shows the line is currently above the signal line, but a decrease in momentum is visible. This suggests a potential bearish crossover or the continuation of the bullish trend, as the pair moves within a tight space.
To this end, a break above $3.100 would indicate a continued bullish trend; otherwise, a break below $3.000 or $2.940 would suggest a downward movement in the near term.
XRP/USDT Analysis: What to Expect
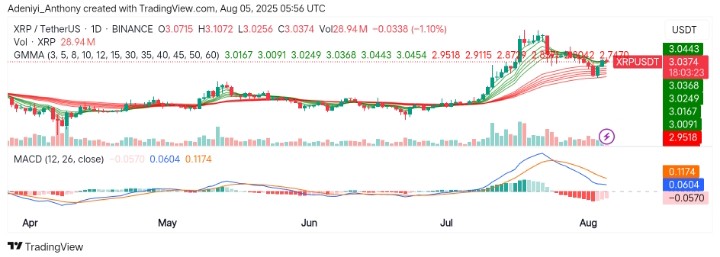
On the daily chart, XRP/USDT value seems to be retracing after a move to the north with though price still sit above $3.000.
The MACD, on onehand, has turned bearish, with the blue line below the orange line, signaling potential further downside a the volume seems to be relatively consistent, showing signs of diminishing strength in recent bullish candles. However, the GMMAs, on the other hand, signal a pause in the bullish track as the sets of EMAs intertwine.
To this end, an attempt at bullish continuation could be made if XRP closes above $3.000; otherwise, if the pair continues with the current condition, a move below $2.940 could indicate deeper retracement.
You can purchase crypto coins here. Buy LBlock