XRP (XRP/USDT) Surge Faces Critical Resistance: Will the Uptrend Continue or Reverse?
Estimated Reading Time: 3 minutes
Don’t invest unless you’re prepared to lose all the money you invest. This is a high-risk investment and you are unlikely to be protected if something goes wrong. Take 2 minutes to learn more

XRP/USDT Long-term Analysis: Ranging
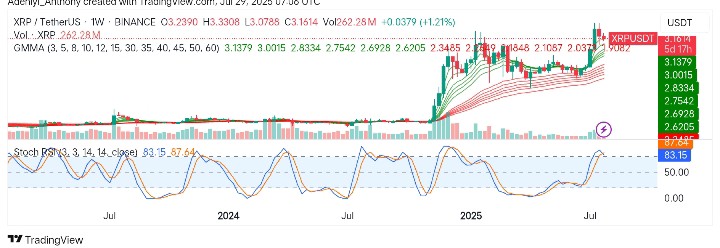
The current price movement for XRP against the Tether is showing signs of consolidation after a sharp rally in recent weeks. Before this moment, the pair had seen a significant upward movement from the recent low. However, the price action reveals signs of exhaustion with the Stochastic RSI in the overbought zone (82.71). To this end, this suggests that the market may be slowing down, and a potential correction could follow, especially considering the overextended bullish momentum.
To this end, XRP trades at $3.1614 with over 262 million traded volumes for the week.
Technical Indicators
Major Resistance Levels: $3.330, $3.240, and $3.131
Major Support Levels: $2.996, $2.830, and $2.750
XRP Weekly Analysis
The analysis of XRP against the Tether on a weekly timeframe shows that the price is currently trading above the Guppy Multiple Moving Averages (GMMA) bands. Still, before this time, the pair was heading south.
Also, the stochastic oscillator’s overbought condition points toward a possible reversal. However, the price is showing signs of exhaustion, and a pullback or sideways movement before a clear breakout or breakdown occurs.
To this end, a strong signal here would be a break below the $2.996 level, confirming the bearish signal. From another point of view, if XRP can maintain a hold above $3.131, a potential move to the north might be seen.
XRP/USDT Analysis: Pair Faces Critical Resistance
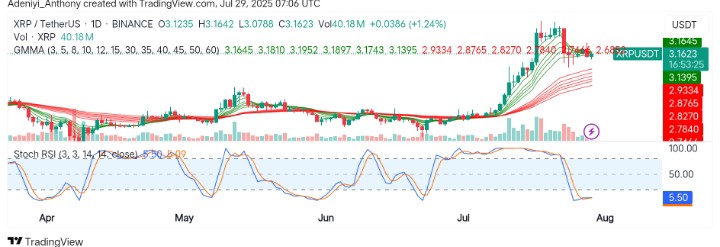
The daily chart shows a strong rally, with XRP/USDT making substantial gains, especially in late June and July. However, the Stochastic RSI appears to be improving from an oversold zone (5.50), signaling that the pair may be gearing up for more action despite the possibilities of a potential pullback.
To this end, the XRP/USDT appears to be maintaining a daily bullish outlook. However, the pair is currently facing resistance around $3.200 with support around $2.919, but with an increasing volume, the pair might establish a new high or continue a range-bound activity.
You can purchase crypto coins here. Buy LBlock