Polygon (MATIC/USD) Price Converges at $0.90
Estimated Reading Time: 3 minutes
Don’t invest unless you’re prepared to lose all the money you invest. This is a high-risk investment and you are unlikely to be protected if something goes wrong. Take 2 minutes to learn more
Polygon Price Prediction – December 4
Presently, there have been signs denoting less-active motions in the behaviors of the MATIC/USD market movers as the crypto price converges around $0.90. Both high and low trading happenings have caged between $0.921 and $0.902 points at an average percentage rate of 1.11 positive.
MATIC/USD Market
Key Levels
Resistance levels: $1, $1.10, $1.20
Support levels: $0.75, $0.70, $0.65
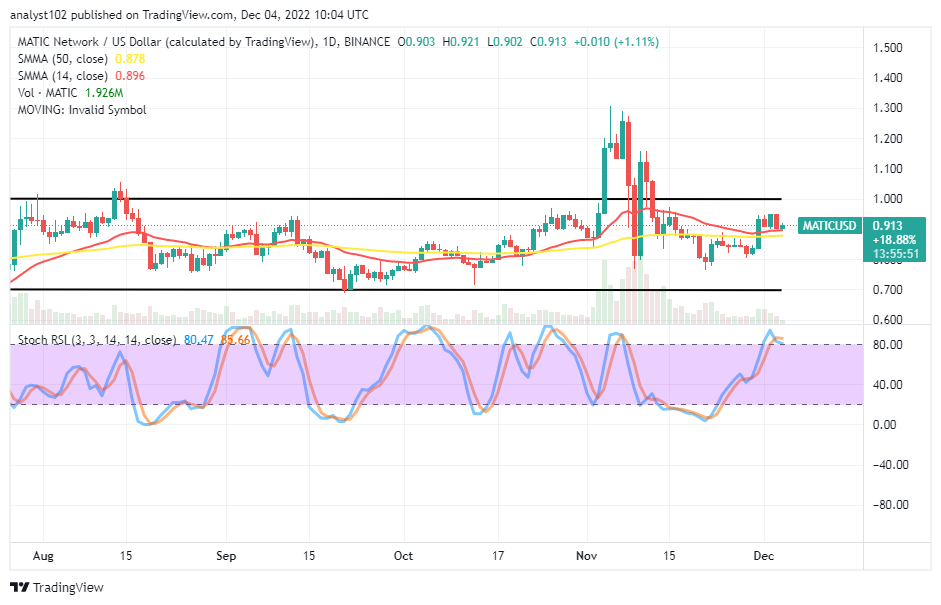
MATIC/USD – Daily Chart
The MATIC/USD daily chart reveals that the crypto’s price converges at $0.90 over a couple of days. It is important to note that the trading values of the crypto economy feature in well-defined range-bound spots characterized by $1 and $0.70 points. The horizontal lines have been to mark those areas. The 14-day SMA indicator is at $0.896, briefly over the $0.878 value line of the 50-day SMA indicator. The Stochastic Oscillators are in the overbought region, trying to cross their lines southbound at 85.66 and 80.47 levels.
What might happen if the MATIC/USD trade price levels consolidate positions near the convergence zone?
There will likely be more ups if the MATIC/USD trade buyers hold their positions firmer against sellers as the crypto’s price converges at the $0.90 level. In the light of that assumption tending to occur as expected, long-position placers have to back up their entries with active price action before execution of their longing orders. An aggressive upsurge against the $1 upper range line will give the market the leverage to revisit past higher-trading resistances of $1.20 or $1.30 in the long run. But, when that is playing out, fresh long positions should be cautious of a reversal in no time.
On the contrary side to the upside of the technical analysis, the reading posture of the Stochastic Oscillators has given a better insightful outlook signaling the probability of seeing the market lose back momentum to the south direction if it fails to break out the upper range spot in the following operations. Bears have to strategize by looking out for a test of the $1 resistance level coupling with active retracement motions to ride alongside. To still dwell further on the current upsurge possibility in the market, buying mode is on the verge of reducing around the upper range line.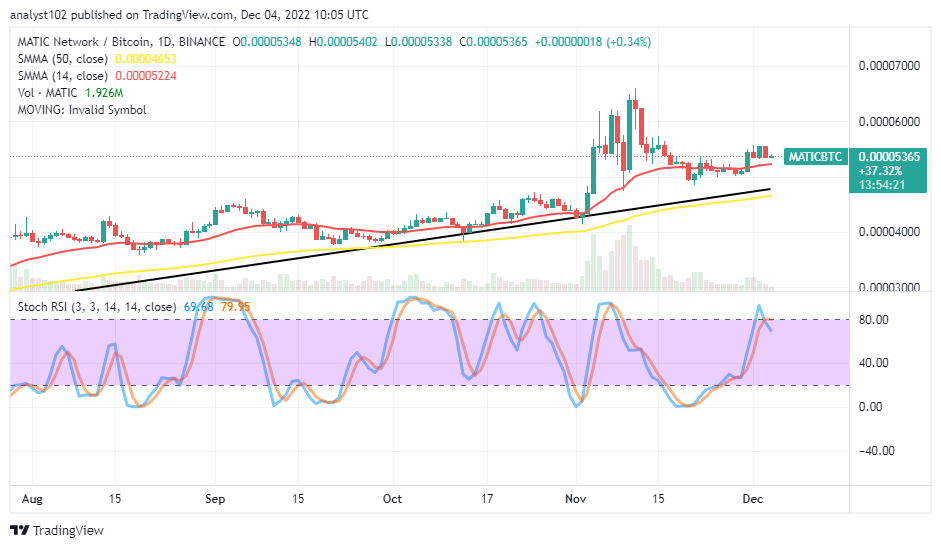
MATIC/BTC Price Analysis
In comparison, Polygon has not appeared to give a significant chance to a declining movement against Bitcoin’s trending ability as the cryptocurrency pair price converges closely over the smaller SMA trend line. The 14-day SMA is over the 50-day SMA. The Stochastic Oscillators have crossed southbound against the 80 range to place at 79.95 and 69.68 levels. That signifies that the base crypto may witness a pit stop around the value of the smaller SMA trading indicator before the stance swings up against its counter-trading crypto afterward.
Note: Cryptosignals.org is not a financial advisor. Do your research before investing your funds in any financial asset or presented product or event. We are not responsible for your investing results.
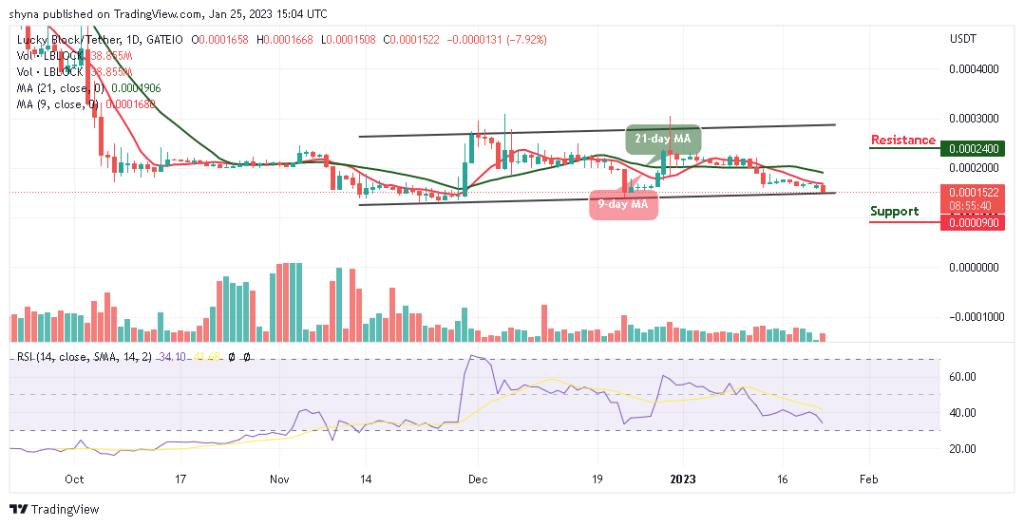
You can purchase Lucky Block here. Buy LBLOCK