XRP (XRP/USDT) Continues Downtrend, Targets Lower Supports
Estimated Reading Time: 3 minutes
Don’t invest unless you’re prepared to lose all the money you invest. This is a high-risk investment and you are unlikely to be protected if something goes wrong. Take 2 minutes to learn more
XRP Long-term Analysis: Bearish
After a strong rally in previous weeks, XRP against the Tether has experienced a significant fluctuation, characterized by a short consolidation phase followed by a sharp decline.
The recent price actions show signs of potential weakness as price heads for recent support. However, if the $2.1043 support level holds, it could be a potential re-entry zone for the buyers as the gap between the Guppy Multiple Moving Averages (GMMAs) remains visible.
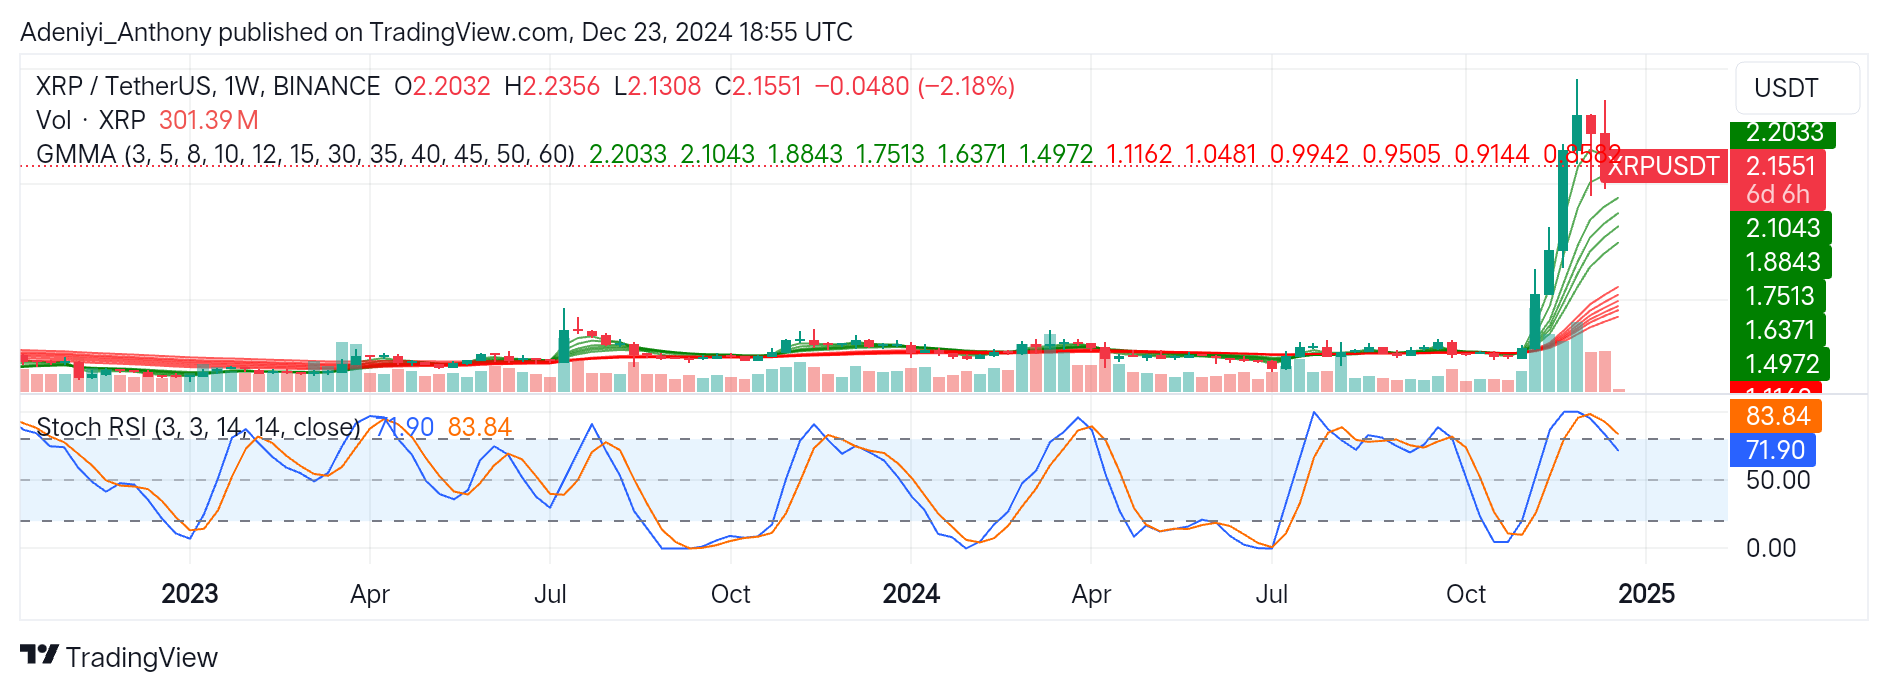
Currently, XRP is trading at $2.1551 with over 301 million traded volumes for the week.
Technical Indicators
Major Resistance Levels: $2.2033, $2.2100, and $2.3000
Major Support Levels: $2.1043, $1.8843, and $1.7513
XRP Technical Analysis
XRP is currently in a bearish phase as indicated by the indicators on the weekly chart. The price of XRP in recent weeks has been breaking below crucial supports, evidenced in the positioning of the price under the green EMAs, as both sets of moving averages converge.
To this end, the current setup has confirmed the continuation of a further downtrend as the price remains under the short-period moving averages. However, the price needs to break above $2.1043 in the hope of a reversal; otherwise, XRP/USDT might face a further downtrend.
On the other hand, the Stochastic RSI shows that XRP/USDT still operates in the overbought region, suggesting that despite the recent fall, the sellers are not in full dominance. Therefore, an improvement in the lines of the indicators would signal a reversal; otherwise, further dips are expected if the condition remains unchanged. To this end, a spike in buying volume above $2.1043 could accelerate a rebound to the upside.
XRP/USDT Analysis: What’s Next?
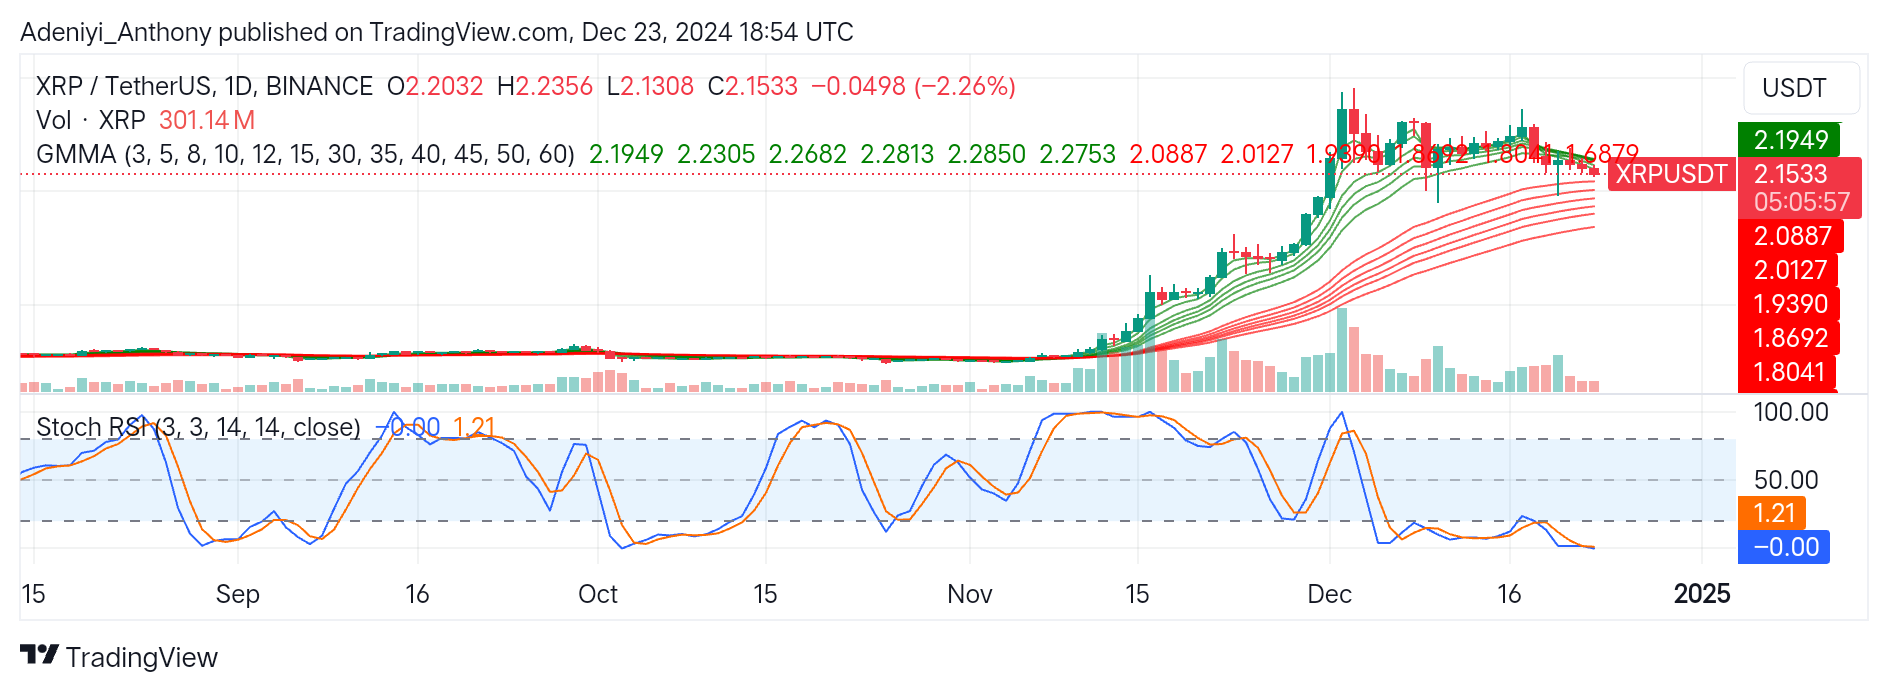
On the daily timeframe, XRP/USDT shows a mix of consolidation and a minor pullback after a recent strong bullish rally. The current price action reveals a potential loss of bullish momentum with the pair breaking below important supports.
The GMMAs, on one hand, signal a diminishing bullish momentum, as both sets of EMAs converge with increasing bearish trading volumes.
On the other hand, the Stochastic oscillator shows that XRP/USDT is oversold with the blue line reading 0.00, indicating the pair is acting under strong bearish pressure. At this juncture, the continuation of the downtrend will depend on whether the pair can break below $2.0887; otherwise, an improvement above $2.1949 with a strong buying volume would signal a reversal.
You can purchase crypto coins here. Buy LBlock