Tamadoge (TAMA/USD): The Bullish Resurgence Still Facing a Key Test
Estimated Reading Time: 2 minutes
Don’t invest unless you’re prepared to lose all the money you invest. This is a high-risk investment and you are unlikely to be protected if something goes wrong. Take 2 minutes to learn more

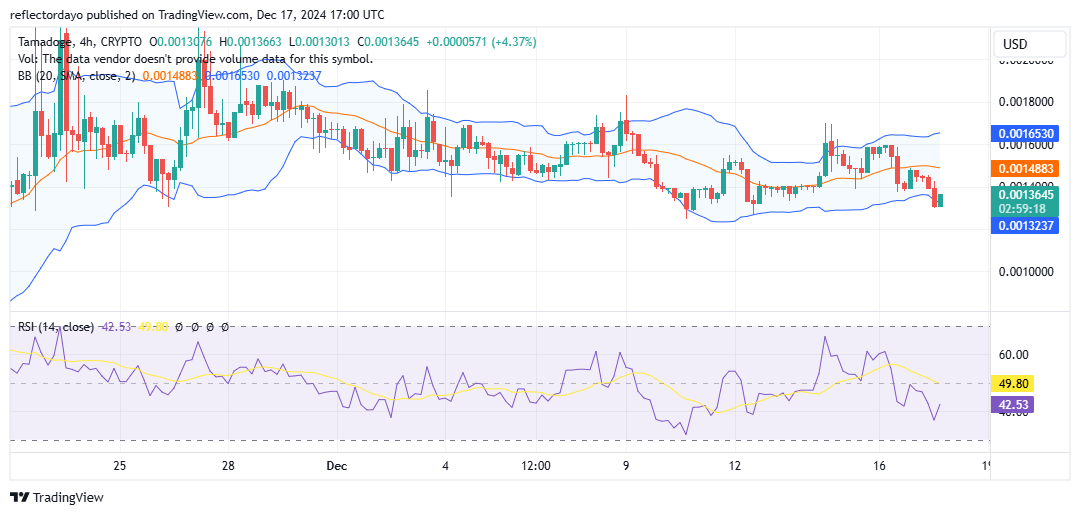
Following the market’s rejection at the $0.0016 price level, the bears appear to have gained a firm grip, leveraging this opportunity to drive prices downward. However, the TAMA/USD bulls have demonstrated resilience, attempting to reverse the trend at the $0.0013 price level. To succeed, they must contend with the prevailing bearish sentiment in the market.
Previously, the $0.0014 price level served as a strong support, holding up the market. However, after the market failed to maintain this level, the bears converted it into a resistance, adding significant pressure on the bulls’ position and making their recovery efforts more challenging.
Key Levels
- Resistance: $0.0018, $0.0019, and $0.0020
- Support: $0.001, $0.0009 and $0.0008
TAMA/USD Price Analysis: The Indicators’ Point of View
In the short term, the following key levels are worth monitoring for a potential bounce: $0.0013, $0.00125, and $0.0012. Currently, the TAMA/USD market is holding its ground at $0.0013, with the bulls actively defending this level.
Investors are likely watching closely to see the outcome of the ongoing struggle between buyers and sellers below the critical $0.0014 resistance level. Meanwhile, the Bollinger Bands indicator reflects a sideways consolidation, signaling that the market remains range-bound. The overall market direction has not yet shifted enough to suggest that the bears have gained definitive control.
Tamadoge Short-Term Outlook: 1-Hour Chart
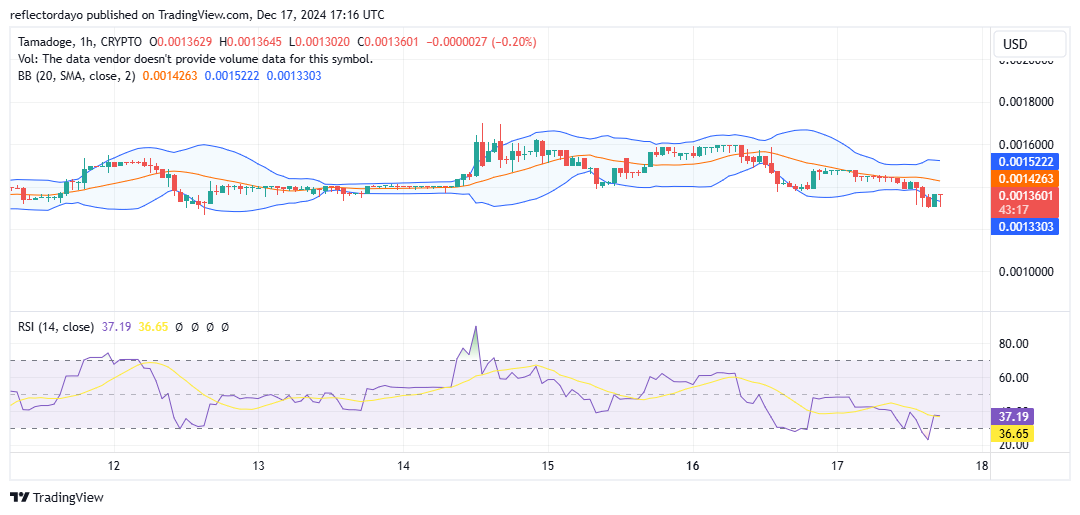
Zooming into a smaller timeframe perspective, the bulls appear to be signaling a potential upward reversal, as evidenced by their repeated rejections of bearish pressure around the $0.0013 support level in recent sessions. However, they are currently facing resistance at the $0.0014 price level.
A sustained breakout above this critical level would indicate that the market is primed for upward momentum, with the next likely target being the $0.0016 price level.