XRP (XRP/USDT) Projects Bullish Condition Despite Correction
Estimated Reading Time: 3 minutes
Don’t invest unless you’re prepared to lose all the money you invest. This is a high-risk investment and you are unlikely to be protected if something goes wrong. Take 2 minutes to learn more
XRP Long-term Analysis: Bullish
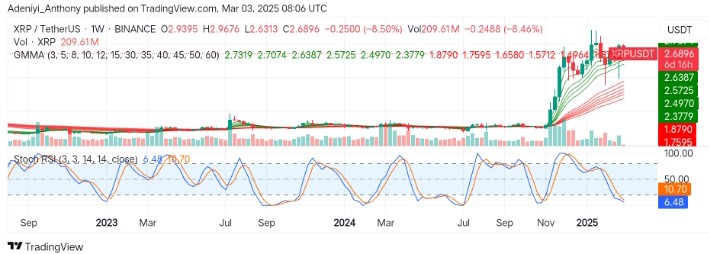
The market for XRP against the Tether on a weekly timeframe shows that the pair has seen a strong bullish trend recently. This is seen in the previous price surge from a consolidation phase. However, current market conditions indicate a notable pullback, as the price drops by 8.50% after trading near the $3.000 psychological level.
To this end, the pair appears to be retracing, and a potential continuation of a bullish trend depends on support at $2,6387. However, the Guppy Multiple Moving Averages (GMMAs) indicate bullish movement is still intact despite the current correction.
Currently, XRP trades at $2.6896, recording 209.61 million traded volumes.
Technical Indicators
Major Resistance Levels: $2.9700, $3.2000, and $3.5000
Major Support Levels: $2.6387, $2.4979, and $2.3779
XRP Technical Analysis
On the weekly timeframe, XRP against the Tether is experiencing a pullback, but the overall market sentiment remains bullish. The GMMAs show that the pair still maintains a bullish structure as the short-period EMAs stay above the long-period EMAs.
On the other hand, the Stochastic RSI operates in the oversold region, suggesting a potential reversal if buyers step in. To this end, the price may hit above $3.0000 provided the $2.6387 support level holds. Conversely, a weakened structure may be seen if this level is breached.
XRP/USDT Analysis: What’s Next?
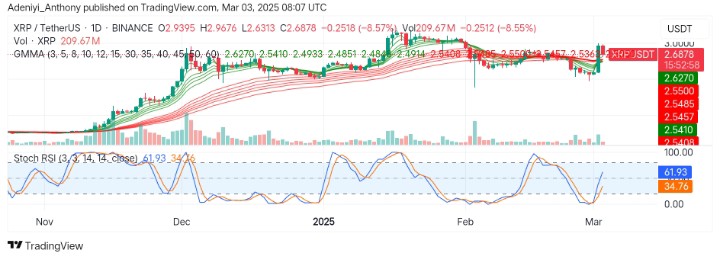
On the daily timeframe, XRP/USDT shows a decline of about 8.57% while closing at $2.6878. The previous price action shows a well-developed bullish candlestick, suggesting the current movement indicates a pullback despite the short-period EMAs breaking above the long-period EMAs.
On the other hand, the Stochastic RSI signals a recovery condition as both lines move to the north. To this, despite current sell-offs, a hold above $2.5410 could trigger a rebound towards $2.850 in the near term. However, continuing current pressure would indicate further movement to the south.
You can purchase crypto coins here. Buy LBlock