XRP (XRP/USDT) Faces a Short-term Correction
Estimated Reading Time: 3 minutes
Don’t invest unless you’re prepared to lose all the money you invest. This is a high-risk investment and you are unlikely to be protected if something goes wrong. Take 2 minutes to learn more
XRP Long-term Analysis: Bullish
The market for XRP against the Tether has experienced a decline after a prolonged bullish rally to the top. The pair has been trending upward since late 2024, with prices above the Guppy Multiple Moving Averages (GMMAs). However, the market seems to be taking a downturn, with prices heading to break below the short-period moving averages.
Recently, the pair’s price appears to be moving southwards, recording a loss of more than 17%, but the overall market sentiment remains bullish. At this point, a sustained momentum may push XRP’s price further downward if the bullish trader fails to intervene.
Currently, XRP trades at $2.1371, with over 500 million volumes traded for the week.
Technical Indicators
Major Resistance Levels: $2.5763, $2.6090, and $2.8000
Major Support Levels: $2.1000, $1.7713, and $1.6602
XRP Technical Analysis
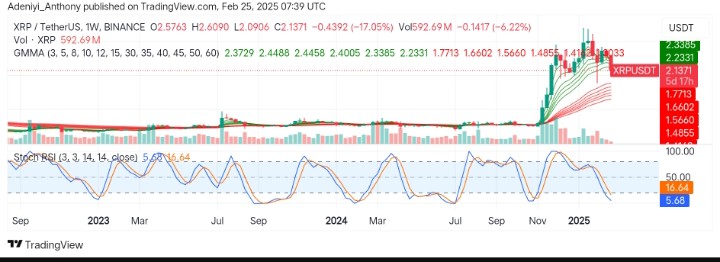
On the weekly timeframe, the market for XRP against the USDT is currently in a short-term correction, with bullish overall market conditions as suggested by the GMMAs.
On the other hand, the Stochastic RSI signals a potential bounce is on the way. However, confirmations are needed as the lines of the indicator extend further despite displaying an extremely oversold condition.
To this end, more bullish participants are needed to push the pair’s price above $2.5000; otherwise, bearish traders would decide the fate of the pair alone.
XRP/USDT Analysis: What’s Next?
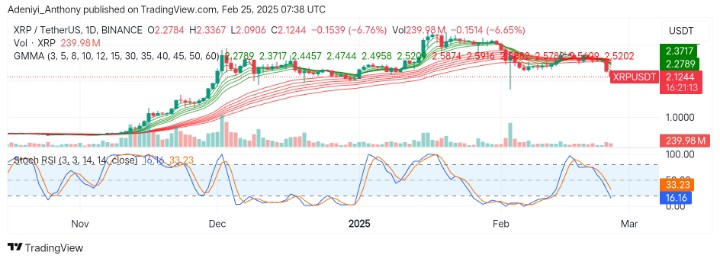
On the daily timeframe, the market appears to be hovering around the GMMAs, suggesting the price is in a consolidation phase. This means a breakout is needed for a strong bullish move.
The stochastic RSI, on the other hand, appears to be in an oversold condition, hinting at a potential bounce, indicating selling pressure may be waning.
Though more confirmation is needed, if the price reclaims the $2.36 resistance level, the possibility of breaking above $2.50 may materialize. Conversely, failure to break above the $2.1000 level could lead to a test of lower support levels.
You can purchase crypto coins here. Buy LBlock