XRP (XRP/USDT) Seeks to Hold Above the $2.9249 Critical Level
Estimated Reading Time: 3 minutes
Don’t invest unless you’re prepared to lose all the money you invest. This is a high-risk investment and you are unlikely to be protected if something goes wrong. Take 2 minutes to learn more
XRP Long-term Analysis: Bullish
The XRP against the Tether pair has shown strong volatility in recent trading sessions, characterized by renewed interest after a prolonged period of consolidation. Since 2024, XRP/USDT has witnessed a strong uptrend, piercing through several resistance levels. However, the market is witnessing a slight retracement, suggesting slight bearish actions and a short-term correction in view as the Stochastic RSI signals an overbought condition is on the horizon.
Recently, the pair’s price seems to be forming higher lows in an uptrend before the sudden surge in price. However, the minor dip of 0.73% suggests identical action as traders await clearer signs.
Currently, XRP trades at $3.0002 with over 60 million traded Volumes.
Technical Indicators
Major Resistance Levels: $3.0394, $3.2900, and $3.6500
Major Support Levels: $2.9249, $2.5763, and $2.1383
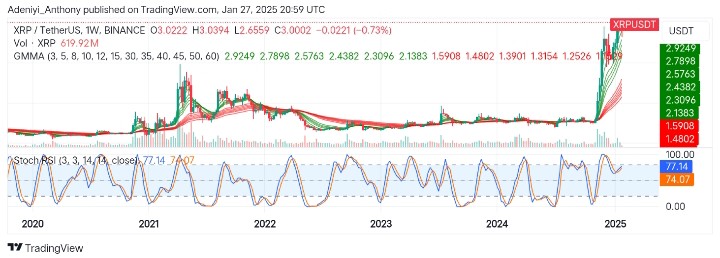
XRP Technical Analysis
The analysis of XRP against the Tether on the weekly timeframe shows that the price is currently holding above a critical support level at $2.9249 despite the overall bullish outlook as suggested by the Guppy Multiple Moving Averages (GMMAs). However, the spread of the two sets of EMAs signals the price may stabilize at the current level.
On the other hand, the Stochastic oscillator at the bottom of the chart suggests price may see a minor correction in the near term as the lines approach the 80-mark level.
To this end, XRP operates at a pivotal stage. Therefore, a break above $3.0394 would signal the resumption of bullish momentum; otherwise, a break below $2.9249 could lead to further declines.
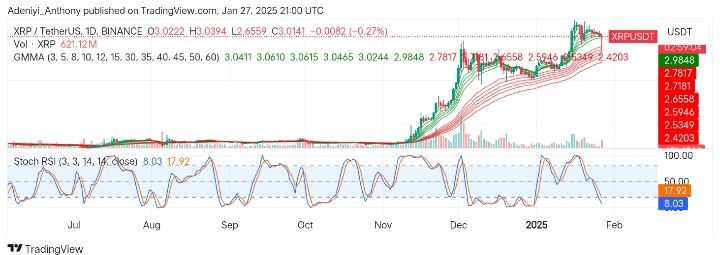
XRP/USDT Analysis: What to Expect
On the daily timeframe, XRP/USDT appears to be testing a major support level after a prolonged uptrend since the end of last year.
However, the green EMAs are still positioned above the red EMAs, suggesting current price action shows that bullish momentum may be weakened.
Also, the Stochastic RSI signals an extremely oversold condition for the pair. This hints at a potential bounce on the horizon. Therefore, if in the near term, the price could break above $3.0593, the pair would continue its bullish momentum; otherwise, a break below $2.7811 may indicate a further price decline.
You can purchase crypto coins here. Buy LBlock