XRP (XRP/USDT) Sees Weakening Momentum as It Struggles Below Key Resistance
Estimated Reading Time: 3 minutes
Don’t invest unless you’re prepared to lose all the money you invest. This is a high-risk investment and you are unlikely to be protected if something goes wrong. Take 2 minutes to learn more
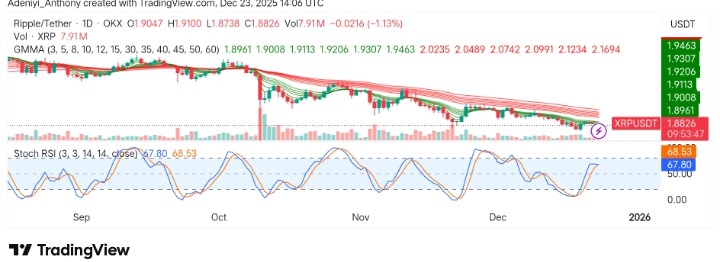
The market for XRP against Tether appears to have dropped 1.87% to $1.88 in the past 24 hours, going down below by 2.2% the broader crypto market decline. As it stands, analysts are of the opinion that this decline is a result of a technical breakdown, noting that XRP failed to break resistance at $1.94 and dropped below crucial Fibonacci support levels.
Additionally, the fall in value can also be linked to the recent distribution by the whales, as large holders decided to offload $1.8 billion in XRP in the last month alone.
Furthermore, a market-wide risk-off sentiment saw Bitcoin dominance rise to 59%; this has made investors shift focus away from altcoins, causing further sell-offs in the market.
Currently, XRP trades at $1.8826 with more than 7.41 million traded volumes at the time of writing.
Technical Indicators
Major Resistance Levels: $1.8961, $1.9200, and $1.9600
Major Support Levels: $1.8700, $1.8600, and $1.8500
Technical Analysis
Technically, XRP against Tether is showing a weakened bullish momentum even as the Guppy Multiple Moving Averages (GMMA) seek to converge in recent times. Additionally, the Stochastic RSI appears to be in the overbought zone, signaling a slight halt in the bearish move, as the sets of EMAs indicate an extended bearish stance.
To this end, the momentum is on the downside with further downside risk if the support level at $1.8700 fails.
$XRP stretching wave (2) like it’s warming up for something dramatic.
What’s your call? pic.twitter.com/SaGFiZ1qdl— More Crypto Online (@Morecryptoonl) December 23, 2025
As it stands, @Morecryptoonline has highlighted a potential setup in XRP. The analyst described the current move as stretching and possibly preparing for a significant move. To this end, this post has prompted a lot of debate.
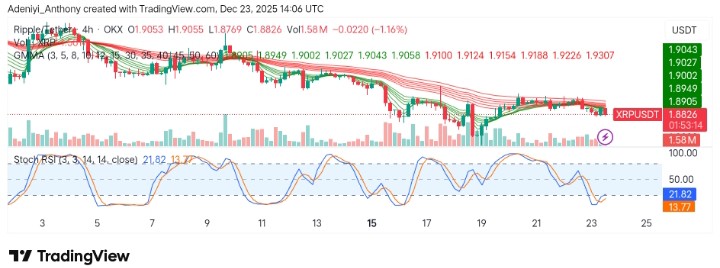
XRP/USDT Analysis: Consolidating Below Key Levels as Sell Pressure Persists
On the 4-hour chart, XRP/USDT appears to have tested the $1.8900–$1.9000 resistance range several times but has failed to push beyond this point, indicating that the bears are still in control.
However, the Stochastic RSI seems to be indicating the potential for a short-term correction to the upside, but the buying interest is limited, as indicated by the volume indicator.
To this end, the indicators are yet to confirm a significant move; therefore, the market could continue to range until a decisive break either way is seen.
You can purchase crypto coins here. Buy Crypto