XRP (XRP/USDT) Faces Consolidation as Key Resistance Holds
Estimated Reading Time: 3 minutes
Don’t invest unless you’re prepared to lose all the money you invest. This is a high-risk investment and you are unlikely to be protected if something goes wrong. Take 2 minutes to learn more
In the last 24 hours, XRP against Tether has faced a fall of 5.9%, going 1.8% below the broader crypto market. As it stands, the mixed reactions to the RLUSD movement to Ethereum L2s, the break below $1.93, and Bitcoin dominance have been suggested to be the factors behind this bearish movement.
Technically, the pair is on a downtrend and oversold, as suggested by the Guppy Multiple Moving Averages (GMMA) and the Stochastic RSI, with a dropping participation level alongside.
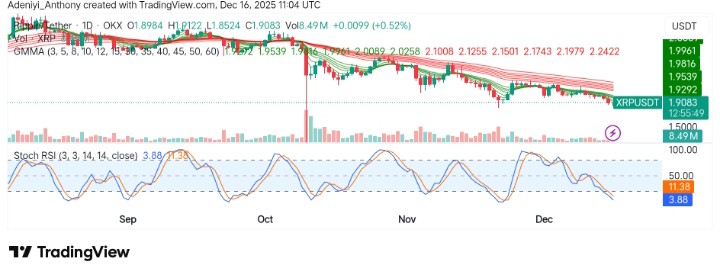
To this end, XRP trades at $1.9083, with over 8.49 million daily volumes.
Technical Indicators
Major Resistance Levels: $1.91, $2.32, and $2.62
Major Support Levels: $1.85, $1.81, and $1.75
Technical Analysis
On the daily chart, XRP against Tether appears to be trading within a tight range. However, the Stochastic RSI is currently in the oversold region, signaling the possibility of a reversal in the short term. Despite this development from the momentum oscillator, the overall trend is still bearish, as indicated by the downward slope of the sets of EMAs.
From another angle, the volume also seems to be decreasing, signaling a lack of strong buying momentum. If XRP fails to break above $1.81, we might see further downside towards the support levels.
Update on XRP
From Elliot’s point of view, XRP has not really moved to detect direction as the token continues to move sideways. However, it appears a meaningful low has formed on the 21st of November, but no five-wave move up has been recorded to confirm the low and a breakout pattern.
As it stands, the market for this token lacks volatility and may not be suitable for range trading, but a low might be expected towards $1.80. However, a move into the $2.32 and $2.58 zone would confirm an upside breakout.
XRP/USDT Analysis: Tests Key Support at $1.87
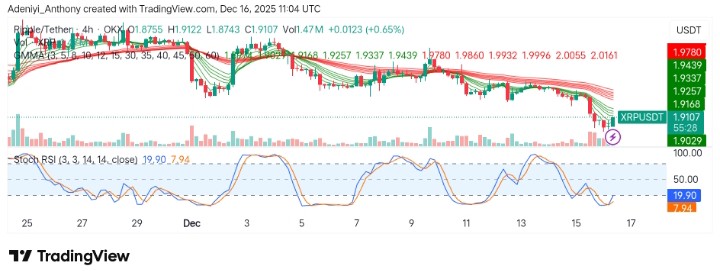
On the 4-hour chart, XRP/USDT shows a clear downtrend with XRP testing the immediate price level. As it stands, the stochastic oscillator appears to be extremely low, just as it is on the daily chart. This is extremely low, signaling that the pair is in oversold conditions.
Additionally, the GMMA indicator is signaling a bearish momentum, as the short-term averages are well below the longer-term averages. If buying pressure picks up from the support zone, a minor rally could occur towards the $1.90 level, but as it stands, the price operates around the support level.
To this end, if there is no reversal from this point, further declines are possible, with the next support likely near $1.85.
You can purchase crypto coins here. Buy Crypto