$SPONGE (SPONGE/USD) Price Under Siege: Bulls Fight Back
Estimated Reading Time: 2 minutes
Don’t invest unless you’re prepared to lose all the money you invest. This is a high-risk investment and you are unlikely to be protected if something goes wrong. Take 2 minutes to learn more

After a period of ranging, the $SPONGE market successfully broke through the first significant resistance level at $0.0000367. However, it then encountered a standstill around the $0.000039 price level, which is close to the key $0.00004 mark. At this critical point, a significant tug-of-war ensued between demand and supply. Contrary to expectations, the market broke sharply downward, reaching a new low of $0.0000193. At this level, the asset became highly attractive to investors, leading to a surge in buying activity and a subsequent increase in price.
Key Market Dynamics:
- Resistance Levels: $0.0010, $0.0011, and $0.0012
- Support Levels: $0.000026, $0.000025, and $0.000024
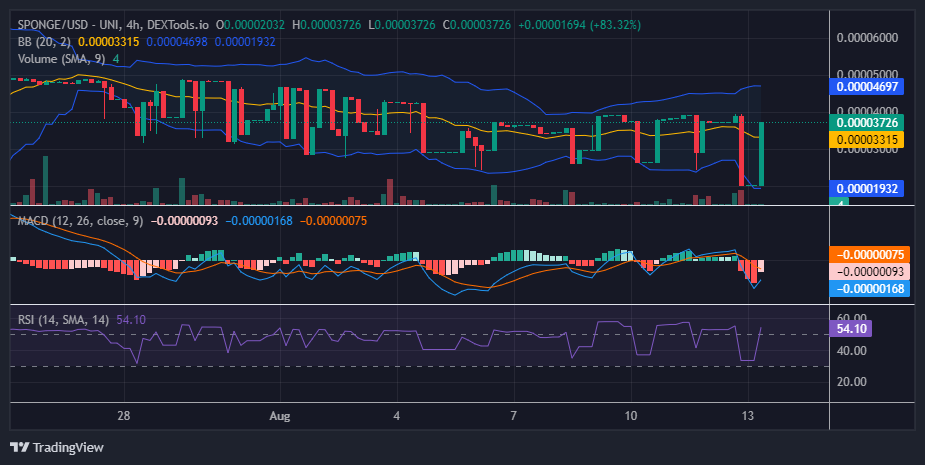
$SPONGE (SPONGE/USD) Technical Outlook
The significant Marubozu candlestick is now positioned at $0.00003726, near the previous resistance level. Based on the current outlook of this Marubozu candlestick, there are no clear signs of resistance yet, suggesting that the bullish trend may still be ongoing. This time, the market might surge past the $0.000039 level, which previously triggered a significant price drop to $0.0000193. However, indicators suggest that the market remains highly volatile, so rapid and unstable price swings are likely in the short term. Despite this crypto signal, there is potential for the market to break above the recent resistance level at $0.000039.
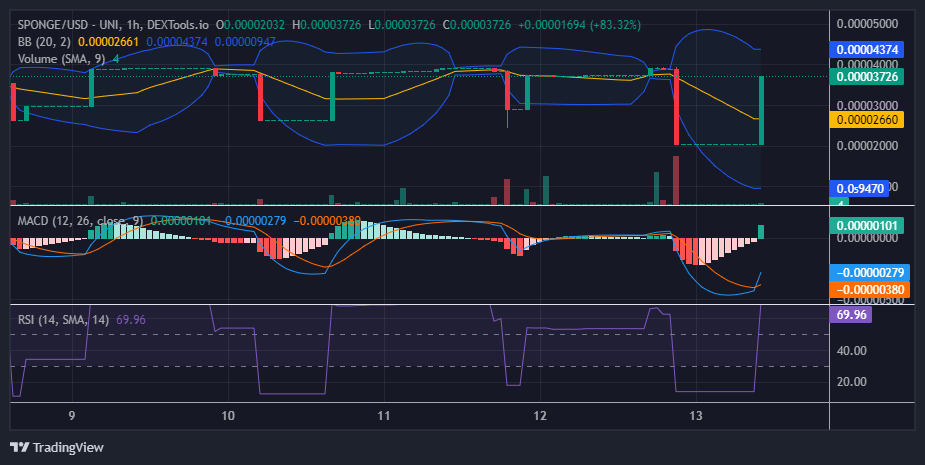
$SPONGE (SPONGE/USD) 1-Hour Chart Insights
From a closer look at the SPONGE/USD market, the Moving Average Convergence Divergence (MACD) indicator shows a lone, tall green histogram after a series of diminishing red histograms, which is typically a bullish signal. This sentiment is supported by the current Marubozu candlestick, which continues to show strength with no upper shadow, indicating no resistance so far. The next potential target could be the previous resistance level at $0.000039, close to the key $0.00004 mark.
Buy SPONGE/USD!
GM, frens 🧽🧽 pic.twitter.com/UAny8Lcp4E
— $SPONGE (@spongeoneth) August 13, 2024
Join the SPONGE community and be part of the next big crypto sensation! Buy Sponge ($SPONGE) today!