SPONGE (SPONGE/USD) Battles Crucial Resistance at $0.00004
Estimated Reading Time: 3 minutes
Don’t invest unless you’re prepared to lose all the money you invest. This is a high-risk investment and you are unlikely to be protected if something goes wrong. Take 2 minutes to learn more

The SPONGE/USD market has recently garnered significant investor interest, surging past the $0.0000367 level. This breakthrough suggests a potential bullish reversal following a period of consolidation beneath a descending resistance line. Additionally, the market’s ability to break above the initial resistance level, around $0.000036, has fueled further bullish sentiment, setting the stage for a potential move toward the $0.00004 mark. The immediate target is now the critical $0.00004 level. A decisive breach of this resistance is likely to attract increased bullish interest, potentially sustaining an extended uptrend.
Key Market Dynamics:
- Resistance Levels: $0.0010, $0.0011, and $0.0012
- Support Levels: $0.000026, $0.000025, and $0.000024
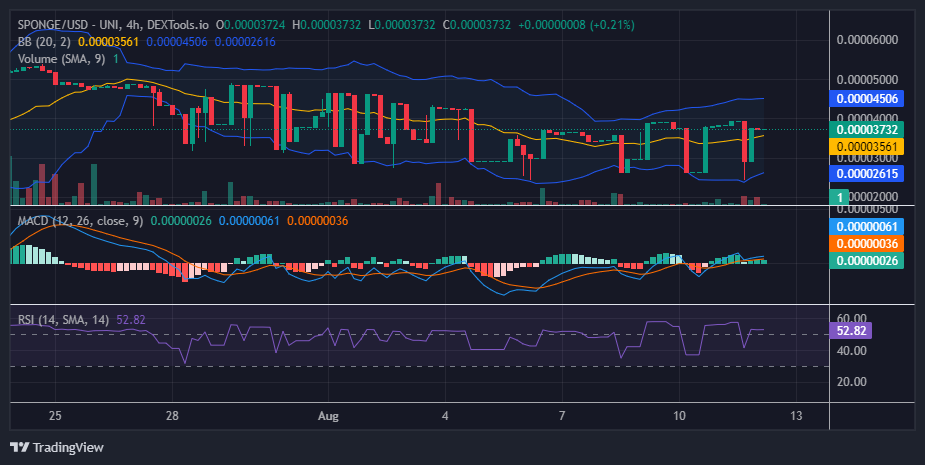
$SPONGE (SPONGE/USD) Technical Outlook
The 4-hour timeframe reveals a strong bullish dominance that emerged during the final session of yesterday’s trading activities, highlighted by a clean Marubozu candlestick. This crypto signal reinforces the ongoing uptrend, targeting the $0.00004 level, despite the market’s current consolidation around $0.000037. Although the market’s stagnation at this level indicates some vulnerability—given that bearish pressure seems to be encroaching upon the $0.00004 price point, once a bullish stronghold—underlying bullish sentiment has found support around the $0.000026 level. Bullish traders have demonstrated resilience at this support since August 8, typically generating significant bullish momentum from this area.
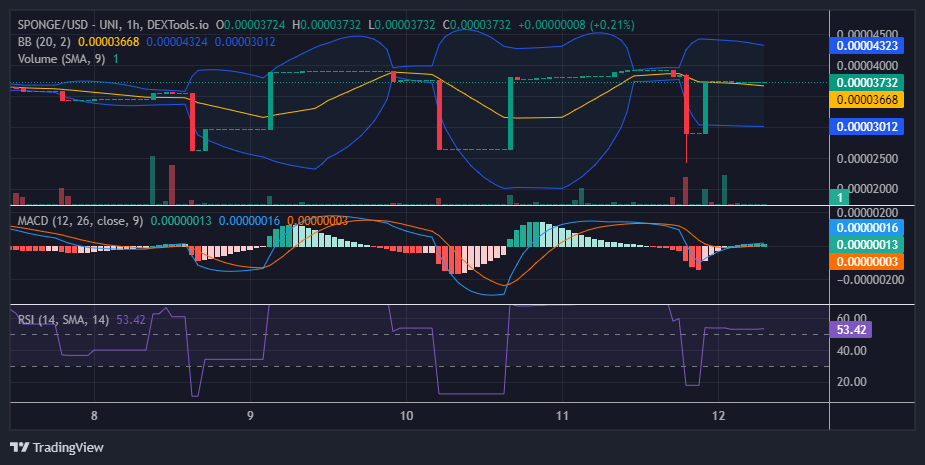
$SPONGE (SPONGE/USD) 1-Hour Chart Insights
The 1-hour chart illustrates a consolidation phase, marked by sideways price movement. The 20-day moving average has dipped below the level of the flat market. The repeated appearance of four-price dojis over several one-hour trading sessions indicates a balanced equilibrium between demand and supply. However, this range-bound movement could precede a significant breakout. The presence of Marubozu candlesticks suggests the aftermath of an accumulation phase, potentially setting the stage for market spikes, as evidenced by occasional upward movements triggered by these candlesticks.
Absorb the damp with $SPONGE!
That $PEPE damp hits different 💦 pic.twitter.com/2NMZqBTDiD
— $SPONGE (@spongeoneth) August 11, 2024
Join the SPONGE community and be part of the next big crypto sensation! Buy Sponge ($SPONGE) today!