OFFICIAL TRUMP (TRUMP/USDT) Struggles for Breakout Amid Narrow Consolidation
Estimated Reading Time: 3 minutes
Don’t invest unless you’re prepared to lose all the money you invest. This is a high-risk investment and you are unlikely to be protected if something goes wrong. Take 2 minutes to learn more

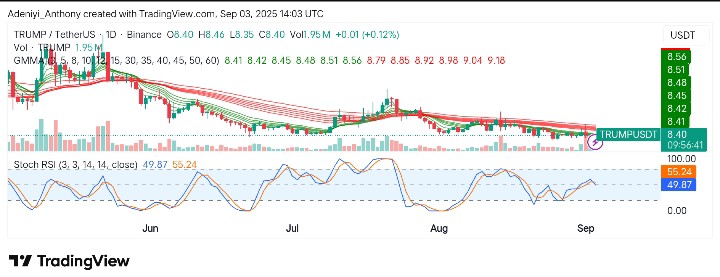
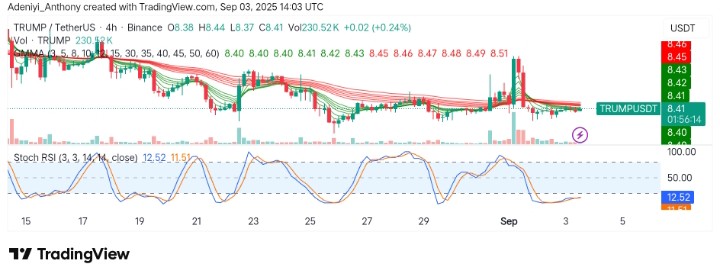
For weeks, the Official Trump against Tether has been trading on a straight line, reflecting indecision between buyers and sellers. At the moment, the last seven candlesticks show a mix of small-bodied candles with long wicks, signaling weak momentum and hesitation around the $8.40 area. However, despite attempts to push higher, the price remains under the layered Guppy Multiple Moving Averages (GMMA) resistance, which continues to press downward like a lid ever since the sell-off.
As it stands, the volume has been relatively low, displaying the lack of conviction in either direction.
Also, the Stochastic RSI seems to be hovering around mid-levels, suggesting that a strong move could soon develop depending on whether momentum picks up to the upside or downside.
At the moment, OFFICIAL TRUMP trades at $8.40 with 1.95 million traded volumes for the day.
Technical Indicators
Major Resistance Levels: $8.56, $8.92, and $9.18
Major Support Levels: $8.35, $8.10, and $7.85
Official Trump Technical Analysis
On the daily timeframe, Official Trump against Tether is showing indecision, indicating neither the bulls nor bears control the market. However, the long wicks of the candles indicate repeated rejection at higher levels, confirming resistance pressure as sellers control the market.
At the moment, there is no strong bullish engulfing candle that has appeared, suggesting weak momentum, as the Stochastic RSI is around mid-range points to potential buildup for the next swing. To this end, the bulls are attempting a mild recovery, but volume is insufficient for a confirmed reversal.
Currently, the market is in a tight consolidation under GMMA compression. A break above $8.56 could unfold. However, failure to hold above $8.35 may drag the price back to $8.10 or lower.
$TRUMP/USDT has been in a consistent downtrend, respecting the descending resistance line since the sharp sell-off earlier this year. Right now, price is holding near a key support zone around the 8.4 USDT level, but there’s no strong sign of reversal yet.
To flip bullish, price… pic.twitter.com/qpeqP6sIsL
— UniChartz (@UniChartz) September 3, 2025
Meanwhile, not quite long ago, @Unichartz dropped an update about $Trump, stating that the coin’s price has been sliding south since the beginning of the year with no trace of reversal.
TRUMPUSDT Analysis: What’s Next?
Activities on the 4H chart show TRUMP/USDT is struggling under a compressed GMMA cluster, which is keeping the price suppressed. However, the Stochastic RSI is sitting deep in oversold territory, hinting at possible upward momentum if buying pressure kicks in.
To this end, it looks like volume spikes have appeared at failed breakout attempts, proving sellers are still active, with $8.45 rejecting the attempt to break to the north. As it stands, immediate support at $8.35 is fragile, and a breakdown could invite a deeper test.
You can purchase crypto coins here. Buy Crypto