OFFICIAL TRUMP (TRUMP/USDT) Eyes Potential Price Reversal
Estimated Reading Time: 3 minutes
Don’t invest unless you’re prepared to lose all the money you invest. This is a high-risk investment and you are unlikely to be protected if something goes wrong. Take 2 minutes to learn more

The market for Official Trump against Tether has faced a prolonged downtrend after hitting above $10.00 before the month of June. However, the pair has taken a downturn from that zenith and is now showing signs of potential exhaustion in bearish momentum as the gap between the Guppy Multiple Moving Averages (GMMA) reduces.
Though the sentiment around the market remains cautious, the Stochastic RSI hints about a possible rebound in the market if buyers’ participation increases.
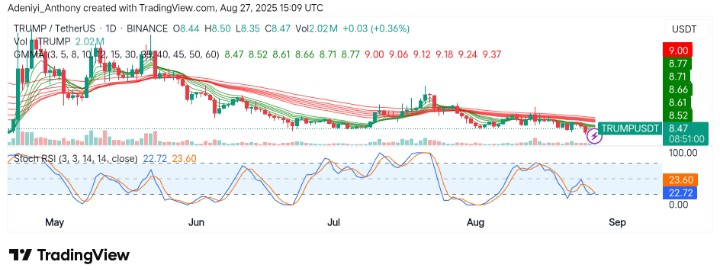
Currently, Official Trump trades at $8.45 with 2.02 million traded volumes for the day.
Technical Indicators
Major Resistance Levels: $8.77, $9.06, and $9.40
Major Support Levels: $8.35, $8.10, and $7.80
OFFICIAL TRUMP Analysis
On the daily timeframe, the price of Official Trump appears to be trading beneath both EMAs of the GMMA, hovering between $8.50 and $9.20. The market at the moment operates without momentum buildup. However, the Stochastic RSI shows the oversold condition of the pair might trigger a short-term bounce if bullish pressure pushes the blue line above the orange.
To this end, bearish pressure may be waning as suggested by the decreasing volume. A breakout above $8.77 with strong volume would strengthen the bullish reversal attempt.
Moreover, @Cmrsbtc in a tweet announces Canary Capital’s intention towards filing for a Trump ETF. Hopefully, this move brings about positive impact on the market.
🚨BREAKING NEWS🚨
Canary Capital files S-1 to launch $TRUMP ETF
I have a strong belief the bull market will peak with the launch of all altcoins ETFs. pic.twitter.com/yHn0xN37Kb— Crypto Millionaire Rohit Sharma (@cmrsbtc) August 27, 2025
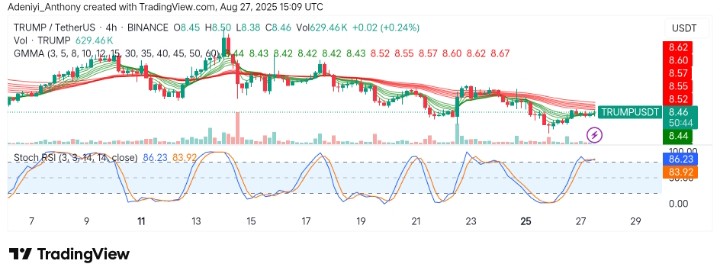
TRUMP/USDT Short-term Analysis: Displaying Relief Rally Within Bearish Structure
TRUMP/USDT on the 4H timeframe is displaying an early sign of recovery though holding above the $8.35 support level. Also, the short-period EMAs of the GMMA appear to be struggling to break above the long-period EMAs. However, indications from the Stochastic RSI suggest a potential northbound movement despite the overbought condition.
As it stands, the recurring of higher lows within the daily timeframe suggests a potential base formation. To this end, a decisive move above $8.52 would open the door for $8.67 and larger gains. Conversely, if the price gets rejected at the current resistance, a move towards $8.10 could be the next.
You can purchase crypto coins here. Buy Crypto