BNB (BNB/USDT) Maintains Bullish Strength as Market Eyes Key Levels
Estimated Reading Time: 3 minutes
Don’t invest unless you’re prepared to lose all the money you invest. This is a high-risk investment and you are unlikely to be protected if something goes wrong. Take 2 minutes to learn more

BNB Long-term Analysis: Bullish
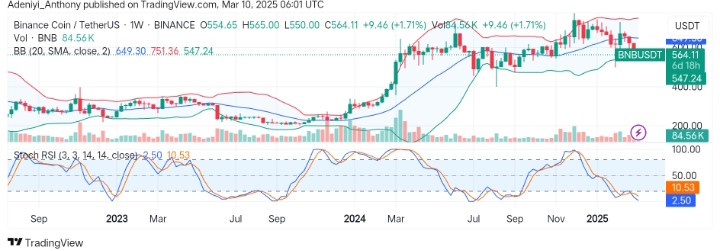
The market for BNB against the Tether has continued to maintain bullish momentum despite the recent drag-down from $750. The pair has experienced a gain of 1.71% despite trading near a critical zone.
Recently, the pair’s price has shown resilience despite market fluctuations, as the Bollinger bands indicate a narrowing range. This indicates potential volatility ahead. However, the Stochastic RSI hovers in the oversold zone, hinting at a possible reversal.
Currently, BNB trades at $564.11, recording over 84 thousand traded volumes at the start of the week.
Technical Indicators
Major Resistance Levels: $600, $650, and $750
Major Support Levels: $547, $500, and $450
BNB Technical Analysis
The analysis for BNB against the Tether on a weekly timeframe shows that the pair is maintaining a bullish outlook despite the recent market price movement. However, the Bollinger bands indicate the pair may enter a consolidation phase soon, seeking a direction to break into.
On the other hand, the Stochastic oscillator suggests the pair hovers at a critical level, signaling a lack of direction, as the lines prepare for a crossover. To this end, a breakout above $600 could propel the price toward a higher resistance level; conversely, as market traders await confirmation, a break below $547 could indicate further retracement to the south.
BNB/USDT Analysis: A Breakout to Which Side?
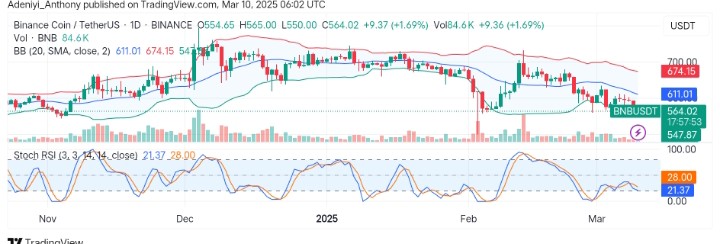
On the daily timeframe, BNB/USDT currently consolidates near the lower band while facing down, bringing to light previous selling activities.
The Stochastic RSI at the bottom of the chart shows the tendency of further movement to the south as the lines extend downward. However, developing candlestick shows that bullish traders are trooping into the market.
To this end, traders should wait for confirmation above $590 for a bullish breakout; otherwise, a fall below $547 would suggest an impending move to the south.
You can purchase crypto coins here. Buy LBlock