XRP (XRP/USDT) Traders Battle Amid Trend Cool-Off
Estimated Reading Time: 3 minutes
Don’t invest unless you’re prepared to lose all the money you invest. This is a high-risk investment and you are unlikely to be protected if something goes wrong. Take 2 minutes to learn more
XRP Long-term Analysis: Ranging
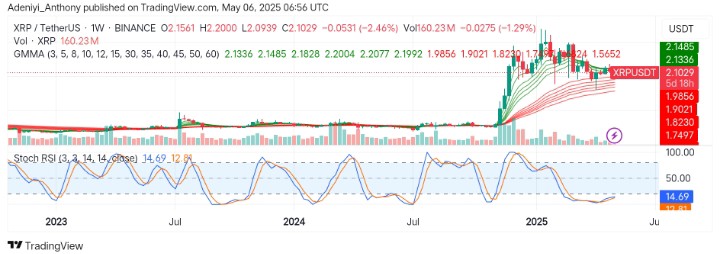
The market sentiment around XRP against the Tether currently shows a range-bound action after a significant bullish move in the early part of 2024. However, the pair’s price appears to be hovering between the sets of exponential moving averages of the Guppy Multiple Averages, presenting the ongoing battle among the traders after a bullish exhaustion.
Recently, the pair peaked at $2.2077 before retracing towards the $2.1000 zone. Still, as it stands, the volume appears to be decreasing slightly, suggesting potential bearish action, while the Stochastic RSI signals a potential upside movement in the coming weeks.
Currently, XRP trades at $2.1029, recording over 160 million traded volumes for the week.
Technical Indicators
Major Resistance Levels: $2.2077, $2.3300, and $2.4500
Major Support Levels: $2.000, $1.8200, and $1.7400
XRP Technical Analysis
The analysis of XRP against the Tether appears to be pulling back in the short term. However, the price appears to be holding above the long-period EMAs, indicating the bullish structure is still maintained.
On the other hand, the Stochastic RSI signals an oversold condition for the pair, suggesting early and possible potential north-bound movement as the lines point upward from the deep.
To this end, if the pair can catch a bounce above $2.2077 in the coming weeks, a trade towards $2.4500 may materialize; otherwise, a break below $2.0000 would lead to a move towards $1.7400.
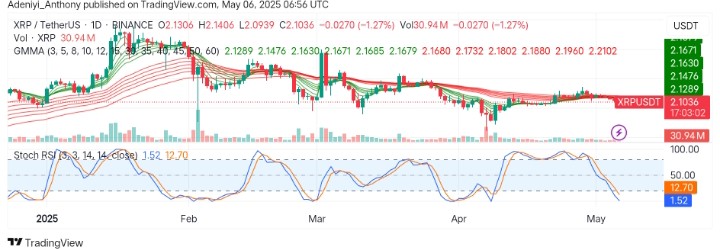
XRP/USDT Analysis: A Bullish Continuation or Breakdown?
On the daily chart, XRP/USDT appears to be coiling just below the GMMAs as price action remains under the $2.1300 zone. However, the set of moving averages appears to be bearish-biased with downward fan-out, suggesting an active selling pressure despite the current wait-and-see condition in the market.
From another angle, the Stochastic oscillator is deeply oversold, signaling that a short-term rebound is possible if the bulls step in.
As it stands, a daily close above $2.1500 could flip momentum bullish and trigger a trend reversal attempt; otherwise, a break below $2.0000 would lead to a deepening to the south before bullish traders’ re-entrance.
You can purchase crypto coins here. Buy LBlock