UMA (UMAUSD) May Break Upwards Using the Double-Bottom Formation
Estimated Reading Time: 3 minutes
Don’t invest unless you’re prepared to lose all the money you invest. This is a high-risk investment and you are unlikely to be protected if something goes wrong. Take 2 minutes to learn more

Free Crypto Signals Channel
UMAUSD Analysis – The price may follow the double-bottom formation track to a breakout
UMAUSD may break upwards using the double-bottom bullish formation. The sellers have been dealing with a lot of blows in the market. They have had the upper hand in the affairs of the market since late last year. Every attempt by the buyers to make progress in the market has often been cut short. The latest attempt by the market to push the price to a higher level is by using a double-bottom bullish structure. This may lead to a breakout for the market.
UMAUSD Key Levels
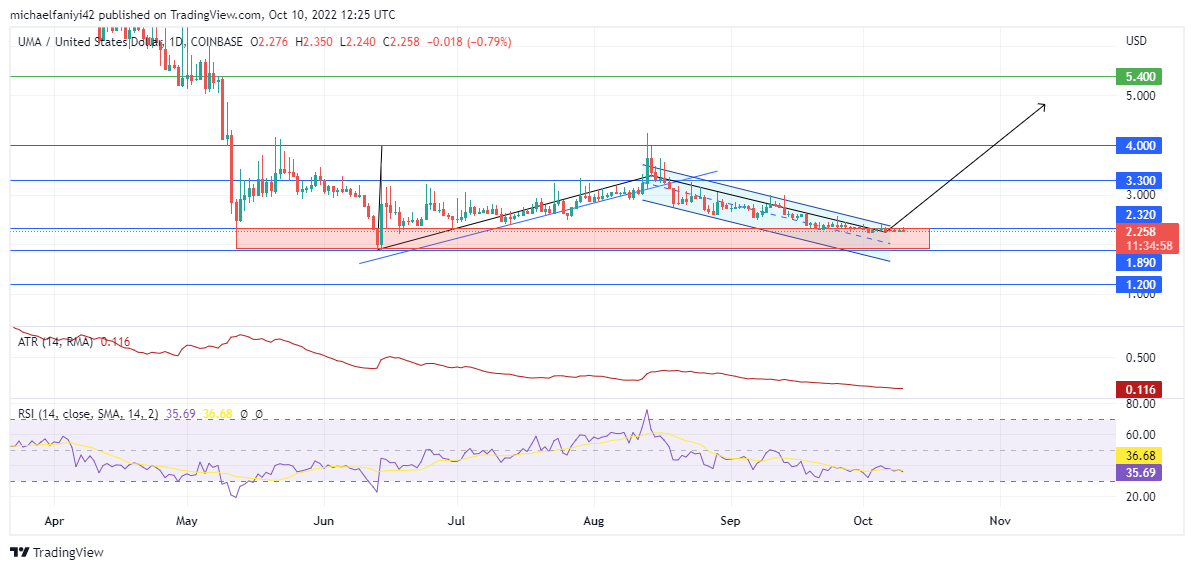
Resistance Levels: $5.400, $4.000, $3.300
Support Levels: $2.320, $1.890, $1.200
UMAUSD has been limited below the $4.000 resistance level since it dropped below it on the 11th of May. The buyers have managed to build solid support to manage the downward liquidity flow. The support level is anchored between $2.320 and $1.890. With that in place, the bulls have been able to throw a couple of punches to break the supply, but it has been rather unsuccessful.
The UMAUSD market is now perfectly set for the price to follow a double bottom formation, which is a bullish pattern. If well executed, it will lead the buyers to break past the $4.000 supply level. The price is currently strengthening at $2.320 in preparation for an increase. A decrease in volatility has accompanied the formation of the structure, as shown by the ATR, but for the structure to work out, market volatility has to increase significantly.
Market Expectation
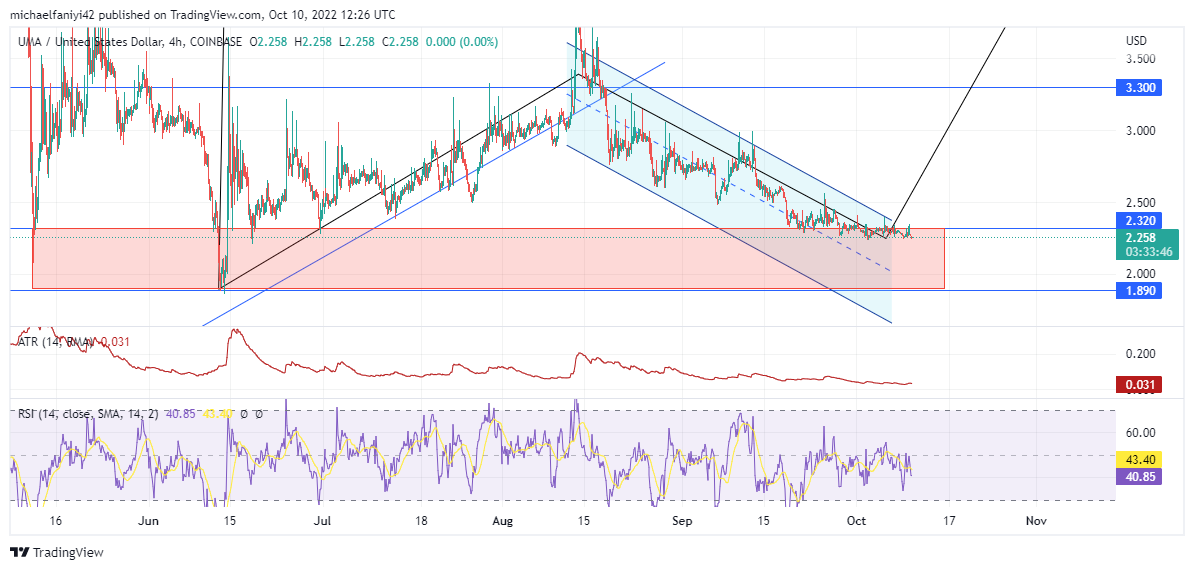
The ATR (Average True Range) indicator is similarly showing a plunge in volatility on the 4-hour chart. The coin is also expected to rise significantly as buyers gather enough momentum to reach this feat. While the RSI (Relative Strength Index) on the 4-hour chart is generally in the bearish half of the chart, on the daily chart it is hovering above the oversold region. This shows that the price could shoot up any time from now; $5.400 is the target.
You can purchase Lucky Block here. Buy LBLOCK
Note: Cryptosignals.org is not a financial advisor. Do your research before investing your funds in any financial asset or presented product or event. We are not responsible for your investing results.