Bancor (BNTUSD) Bears Remain in Control of the Market
Estimated Reading Time: 2 minutes
Don’t invest unless you’re prepared to lose all the money you invest. This is a high-risk investment and you are unlikely to be protected if something goes wrong. Take 2 minutes to learn more
Bears Remain in Control of Bancor
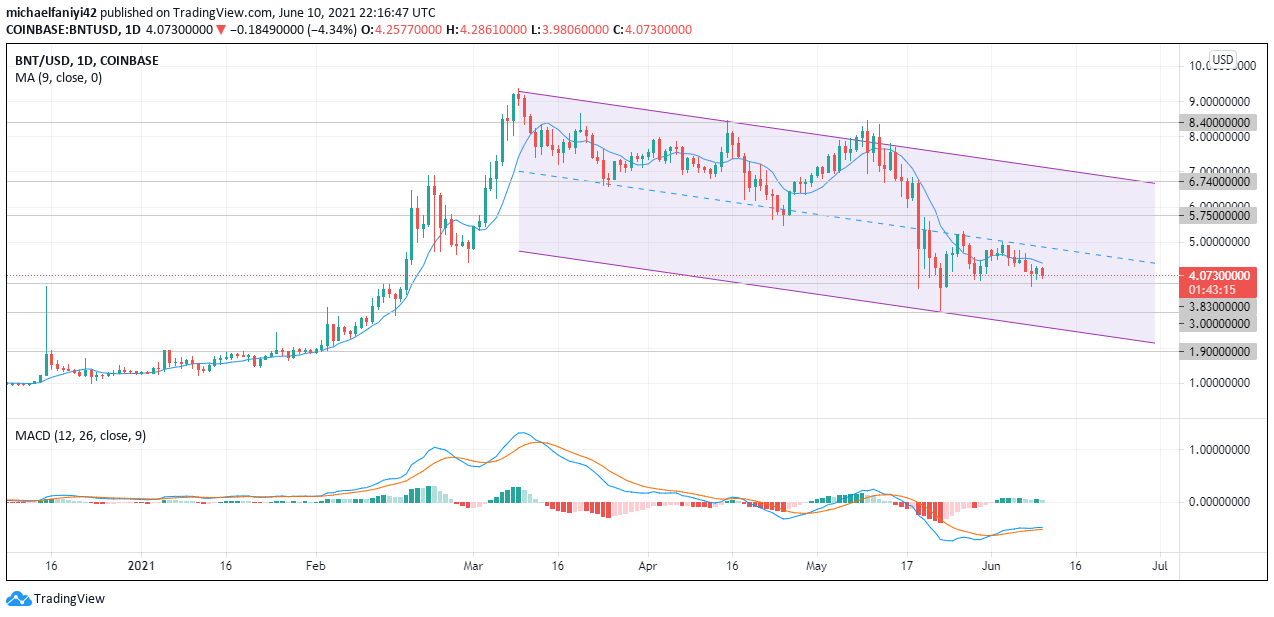
Bancor remains under the control of the bears and is set for more downside. A pump in price had initially occurred between the 3rd of February and the 8th of March 2021. The pump lifted the price of Bancor from $1.900 to $9.400 which is more than a 390% increase. Afterward, the buyers got exhausted immediately ceding control to the bears to gradually feast on the market. The market has since been descending through a parallel channel.
The bulls attempted a comeback on the 26th of April 2021 and broke out of the channel but were ultimately knocked back at the $8.400 resistance zone. The price then fell into the hands of the bear once again, who eventually pulled Bancor down to the lower half of the channel at the $3.830 support. Since then, any attempt of the bulls to gain control has been met with equal resistance by the bears.
The price has touched the descending channel mid line twice and has been knocked back consistently. On the daily chart, the 9MA (Moving Average) is above the candlesticks. The MACD (Moving Average Convergence Divergence) has its signal lines well below in the lower half. Its histogram bars are on the decline in height and strength. All these firmly point to bearish domination of the market.
BTNUSD Significant Zones
Resistance Zones: $8.400, $6.740, $5.750
Support Zones: $3.830, $3.000, $1.900

What Next For Bancor?

On the 4-hour chart, Bancor has formed a descending triangle. The 9MA remains above the candlestick for a short set-up. The MACD has its signal line crossing each other downwards accompanied by reducing histogram bars to signify continuous bearish actions.
The price is expected to break out downwards towards the lower border of the descending channel.
Note: Cryptosignal.org is not a financial advisor. Do your research before investing your funds in any financial asset or presented product or event. We are not responsible for your investing results.