Bitcoin (BTC/USD) Market Maintains $50,000 and $45,000 Levels
Estimated Reading Time: 3 minutes
Don’t invest unless you’re prepared to lose all the money you invest. This is a high-risk investment and you are unlikely to be protected if something goes wrong. Take 2 minutes to learn more
Bitcoin Price Prediction – December 19
There has been a long note stating that the BTC/USD market operation maintains $50,000 and $45,000 lines over a couple of sessions until the present. Price, as of writing, is trading around $47,197 at a smaller-minute negative percentage rate of about 0.73.
BTC/USD Market
Key Levels:
Resistance levels: $50,000, $52,500, $55,000
Support levels: $45,000, $42,500, $40,000
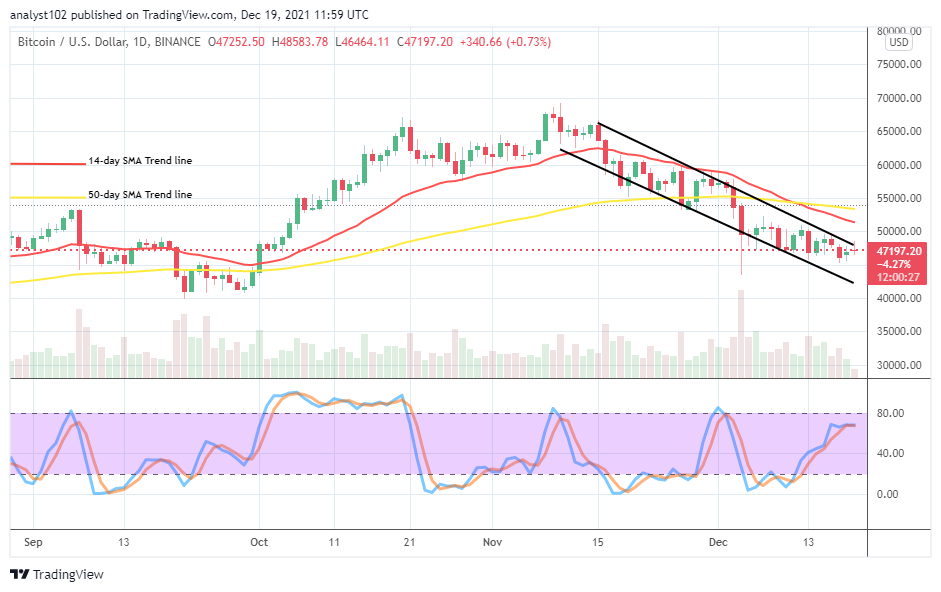
BTC/USD – Daily Chart
The BTC/USD daily chart showcases that the crypto versus the US Dollar market operation maintains $50,000 and $45,000 levels over several days back. The bearish channel trend lines drawn have continued to embody the pace of moving up and down the market. The 50-day SMA trend line is somewhat facing the east over the 14-day SMA trend line. And they are all above the bearish channels. That attests to the fact that the market trades in a lowering spot. The Stochastic Oscillators have moved northward a bit closer to the range of 80, with their lines slightly conjoined. That indicates that the market may face a pause for a while to decide on the subsequent definite direction.
Does the BTC/USD price have the required energy to sustainably start surging higher as the market maintains $50,000 and $45,000?
It appears that the BTC/USD trade operation will be taking more time to get well-repositioned within definite lowers as the crypto-economic market maintains $50,000 and $45,000 levels over time. The lower value-line mentioned earlier has to be the reliable buy zone especially, while the market pushes downward to make a touch for the correction respite. A sudden fearful breakdown will nudge the market settling down for lower zones before allowing long-position takers to settle for a re-preparation afterward.
On the downside of the technical analysis, the BTC/USD market short-position takers now have to look out for a price rejection area possibly around $50,000 level close beneath the sell signal side of the 14-day SMA indicator to consider launching a sell order with levities. A full-fledged bullish candlestick against the level will most likely project the market for higher returns in the subsequent sessions afterward. Therefore, while that assumption is materializing, short-position takers to be wary of their stances.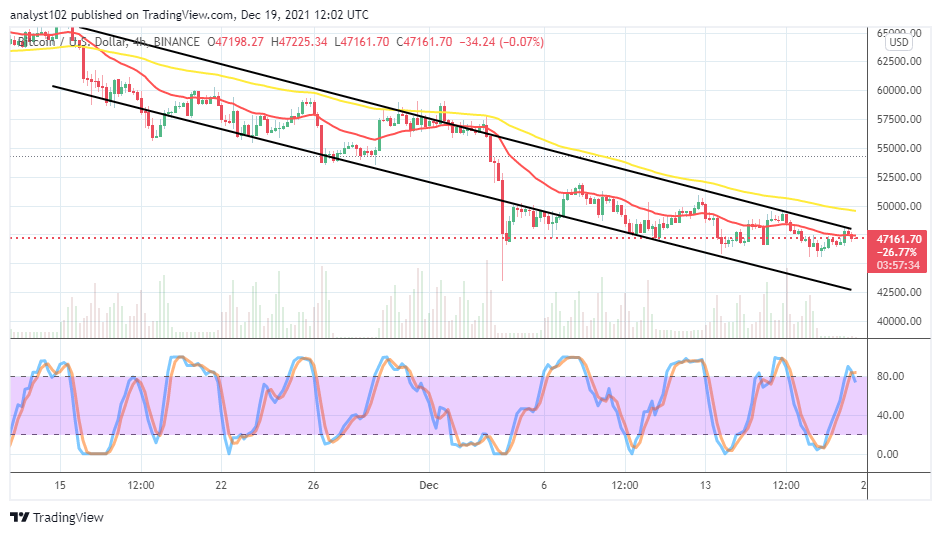
BTC/USD 4-hour Chart
The BTC/USD medium-term chart also shows that the crypto versus the US Dollar operations are in a bearish trend as the market maintains $50,000 and $45,000 levels. Presently, the price is around the mid-point of those values, trading. The 14-day SMA indicator is around the trading spot beneath the 50-day SMA indicator. The Stochastic Oscillators have crossed the lines at the range 80, slightly pointing toward the south. That suggests that some downs may soon dominate the crypto-trading space for a while.
Note: Cryptosignals.org is not a financial advisor. Do your research before investing your funds in any financial asset or presented product or event. We are not responsible for your investing results.
You can purchase crypto coins here. Buy Tokens