Bitcoin (BTC/USD) Trade Features Under $20,000
Estimated Reading Time: 3 minutes
Don’t invest unless you’re prepared to lose all the money you invest. This is a high-risk investment and you are unlikely to be protected if something goes wrong. Take 2 minutes to learn more
Bitcoin Price Prediction – October 19
There have been continual less-active marketing motions between Bitcoin and the US Dollar as the crypto trade features under the $20,000 line in a range-driven outlook. Price’s length valuation of high and low is between $19,367.64 and $19,153.86 at a minute average percentage rate of 0.56 negative.
BTC/USD Market
Key Levels:
Resistance levels: $22,500, $25,500, $27,500
Support levels: $17,500, $15,000, $12,500
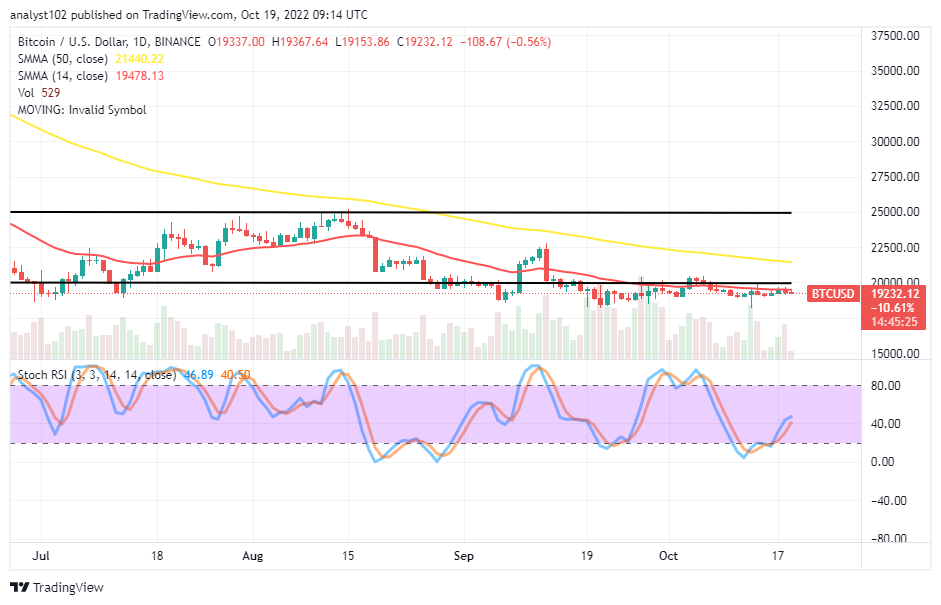
BTC/USD – Daily Chart
The BTC/USD daily chart showcases the crypto trade features under the $20,000 psychological trading level over a long-term period. The 14-day SMA indicator is at a $19,478.13 trading point, underneath the $21,440.22 value line of the 50-day SMA indicator. The Stochastic Oscillators have crossed northbound from the oversold region to reach 40.50 and 46.89 range points. Variant smaller candlesticks are to signify the possibility of seeing the market not ready in a quick term to surge forcefully above the lower horizontal line drawn.
Can the BTC/USD market operation still go into a depression underneath the $20,000 level?
From the psychological trading view of the BTC/USD market, if the crypto’s price encounters rejections below the $20,000 level, the trade is more likely to decline than rising around it as the crypto trade features under the value line. As of the moment, the market may need to reverse a bit to rebuild a stance toward the $17,500 support level before re-swinging back to the upside.
On the downside of the BTC/USD technical analysis, the crypto trade sellers may continue to wait for the Stochastic Oscillators in a higher-range trending zone before determining the probability of seeing the crypto economy getting exhausted in its strength. Before nursing, the notion of being alert when there will be an active devaluating motion to ride along afterward. To the effect of that assumption, the short-position may keep an eye around the 50-day SMA and the $22,500 resistance level.
BTC/USD 4-hour Chart
The BTC/USD medium-term chart reveals the crypto trade features under the $20,000 level out of the main range-bound zones. It has been a while since the market continues to trade closely around the point, finding and rebuilding a position above the $17,500 support level. The Stochastic Oscillators have dipped into the oversold region to open southbound slightly to indicate a falling force is still in motion at 9.46 and 5.73 range values. The overall verdict at this moment of writing is that it’s not too safe to launch new shorting order, as a rallying move can resurface in no time.
Note: Cryptosignals.org is not a financial advisor. Do your research before investing your funds in any financial asset or presented product or event. We are not responsible for your investing results.
You can purchase Lucky Block here. Buy LBLOCK