Bitcoin (BTCUSD) Price to Grow More – Go Long!
Estimated Reading Time: 3 minutes
Don’t invest unless you’re prepared to lose all the money you invest. This is a high-risk investment and you are unlikely to be protected if something goes wrong. Take 2 minutes to learn more
Bitcoin (BTCUSD) Price Forecast: February 3
The Bitcoin (BTCUSD) price is likely to grow more and is an opportunity for long investors. Having finished the downward correction, the crypto might likely continue its upside move if the current support at $22942.38 value holds, and the daily chart closes above the $23824.66 resistance level, then there is a high probability of the price going up to its recent swing high, which is $23966.00 resistance trend line and beyond.
Key Levels:
Resistance Levels: $22000.00, $23000.00, $24000.00
Support Levels: $20000.00, $19000.00, $18000.00
BTC (USD) Long-term Trend: Bullish (4H Chart)
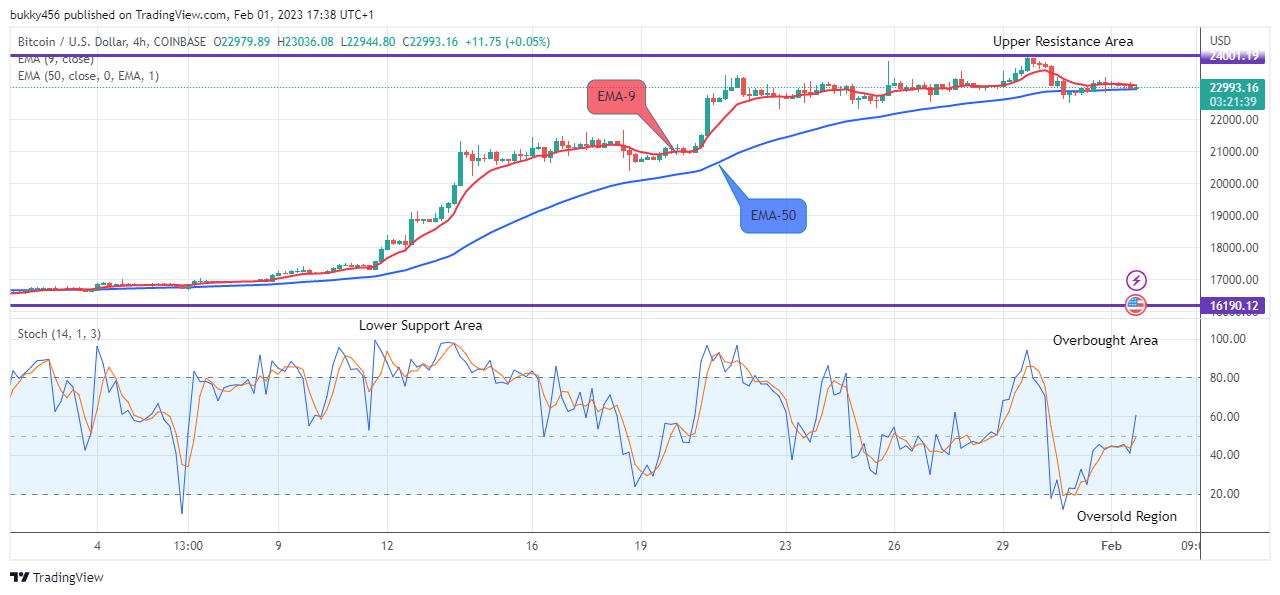
The BTCUSD pair is in a bullish market zone in its higher time frame as can be seen from the chart below. The price is currently recovering and trades above the EMA-50 with its wick touching the EMA-9. This is an indication of an uptrend. The bullish reversal at the $23229.00 high value in the previous action has sustained the crypto above the trend line.
As a result of price rejection in the previous action, buyers have been able to push the price of Bitcoin higher to a $22993.16 high level above the EMA-50 as the 4-hourly session opens today.
Actions from buyers have also increased the coin further up to the $23036.08 resistance value as it journeys up north. More gains are possible if the bulls can put extra effort into the price action.
Next, the momentum indicator pointing upwards suggests the continuation of the bullish trend. The price might possibly retest the $23966.00 supply value which might further extend to the $25000.00 upper resistance area in the days ahead in its long-term outlook.
BTC (USD) Short-term Trend: Bearish (1H Chart)
The coin is now displaying a bearish posture in its short-term outlook. This is due to the high inflow from the short traders. The increase in the momentum by the bears at the $22812.93 support value during yesterday’s session has dropped the coin price below the supply trend line.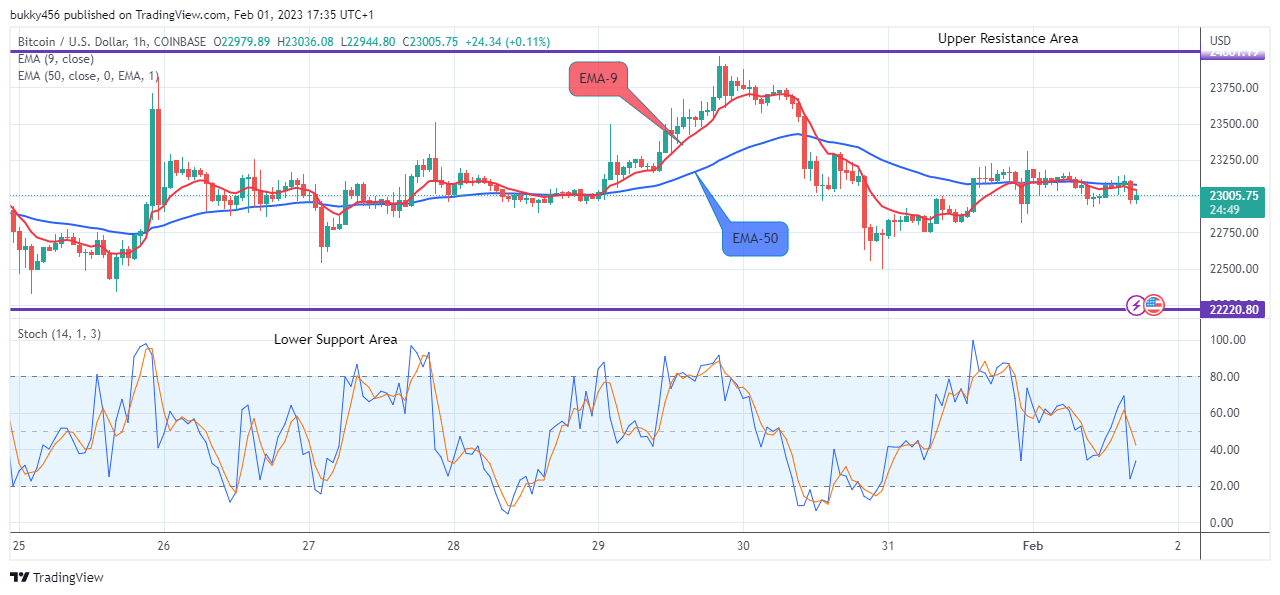
The market price of Bitcoin which has just rebounded at the $22979.89 supply value further increases to the $23036.08 resistance level below the moving averages as the 1-hourly chart opens today, suggesting the recovery and more gains from the bulls. This will give the crypto a high tendency to rise further.
Furthermore, the daily stochastic signals an uptrend, if the bulls could push harder and sustain the coin price above the $23966.00 previous high, the resulting rally may likely grow more to surpass the mentioned supply level to hit the $25000.00 psychological level at the upside in the days ahead in its short-term perspective.
Buy Bitcoin on eToro