Ethereum (ETH/USD) Market Goes Dipping Close to $3,000
Estimated Reading Time: 3 minutes
Don’t invest unless you’re prepared to lose all the money you invest. This is a high-risk investment and you are unlikely to be protected if something goes wrong. Take 2 minutes to learn more
Ethereum Price Prediction – January 10
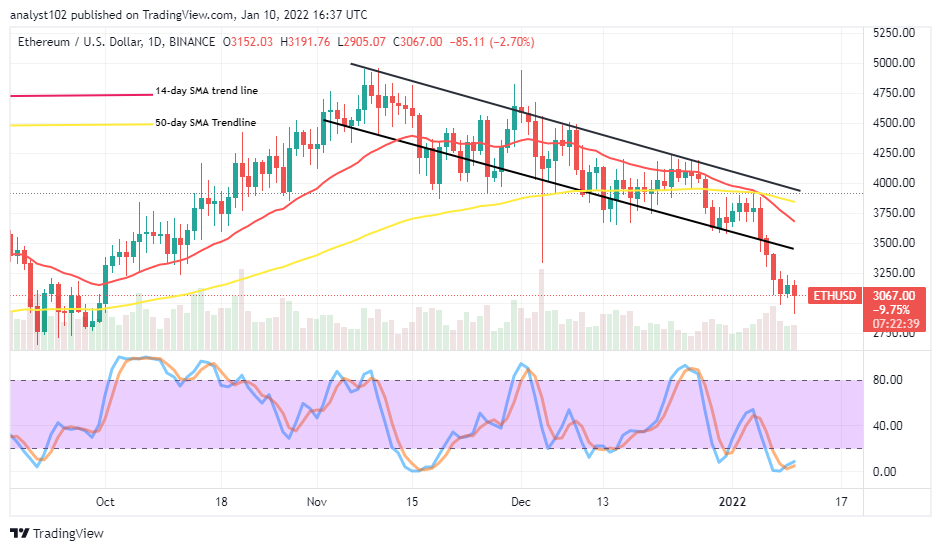
As it is in the ETH/USD trade operations, the crypto market goes dipping close to $3,000 support in a continuation of the recent sharp decline. There have been variant figures representing $3,191 as the higher value. And $3,067 as the lower point achieved ever as of writing presently. And the percentage rate is at about a negative 2.70 as of writing.
ETH/USD Market
Key Levels:
Resistance levels: $3,250, $3,500, $3,750
Support levels: $3,000, $2,750, $2,500
.
ETH/USD – Daily Chart
It recorded that the ETH/USD market goes dipping close to $3,000 support trading level, in a bid to showcase that the crypto is in a bearish movement continuation outlook beneath the indicators, including the bearish channels drawn. The 14-day SMA has intercepted the 50-day SMA to the south side, slightly moving past the $3,750 level to the downside. The Stochastic Oscillators are in the oversold region, attempting to cross the lines northbound at a lower range spot within. That suggests that some ups may now feature as signs of the market striving to rally in no time.
Will the ETH/USD resume rallying against the current bearish trend as the market goes dipping close to $3,000?
There has been no quick or firm reliable sign that the ETH/USD price will resume a rallying motion as the crypto-economic market goes dipping close to $3,000. However, it may be a safe and decent moment for long-position takers to stay alert to observe when there will be a fake dipping move beneath the value line to consider the launching of a buy order.
On the downside of the technical analysis, the ETH/USD market short-position takers may now have to let price rallies to around $3,250 or near beneath the resistance of $3.500 to note if the market will be surrendering to a tougher-trading situation before exerting a sell order position. A sudden fearful breakdown of the $3,000 support level will allow the trade to plunge into unimaginable lower trading zones.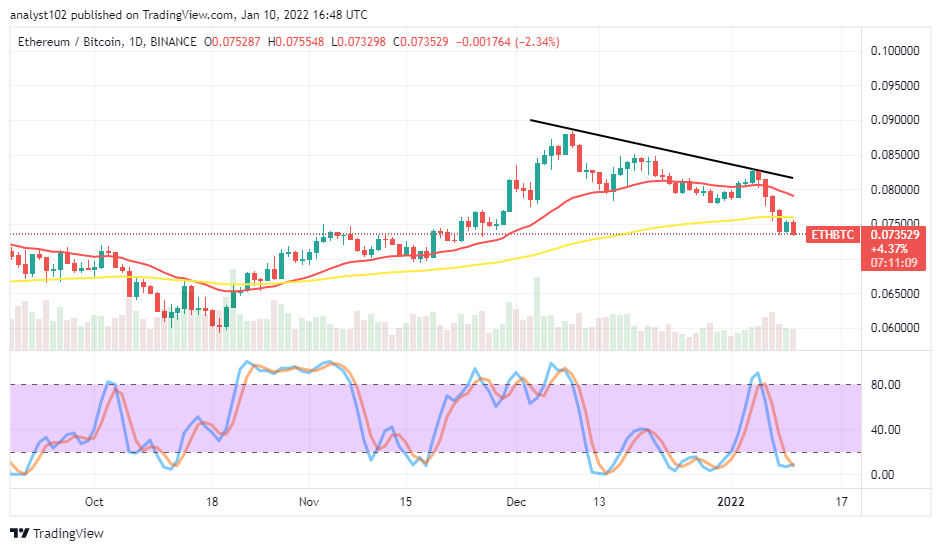
ETH/BTC Price Analysis
In comparison, Ethereum’s trending ability has been prevailed over by the market performance level of Bitcoin in the crypto-economic scales of trading. The price analysis chart depicts that the cryptocurrency pair market goes dipping under the trend lines of the SMAs. The Stochastic Oscillators are in the oversold region, with their lines closed within. That signifies that the base crypto may have to be taking its time toward striving to regain its lost momentums as placed with the flagship counter crypto until a while. But, in the process of the cryptocurrency pair market consolidating closely beneath the trend line of the 50-day SMA for the long-term, the base crypto may potentially lose stances further to its counter trading instrument.
Note: Cryptosignals.org is not a financial advisor. Do your research before investing your funds in any financial asset or presented product or event. We are not responsible for your investing results.
You can purchase crypto coins here. Buy Tokens