Solana (SOL/USD) Market Emerges With a Critical Session at $20
Estimated Reading Time: 3 minutes
Don’t invest unless you’re prepared to lose all the money you invest. This is a high-risk investment and you are unlikely to be protected if something goes wrong. Take 2 minutes to learn more

Solana Price Prediction – February 10
Over time, there has been a long-slower range of downs in the Solana trade against the US Dollar as the crypto market emerges with a critical trading session around $20. The obtainable trending force, as this technical piece has been, shows that sellers’ reaction has only pushed to $20.31, and the uprise has a $21.20 line to its advantage at a rate 0f 2.59 percent positive.
SOL/USD Market
Key Levels:
Resistance levels: $25, $27.50, $30
Support levels: $17.50, $15, $12.50
SOL/USD – Daily Chart
It is revealed on the SOL/USD daily chart that the crypto-economic market emerges with a critical trading session around the $20 level. The 50-day SMA indicator Is at the $20.99 value line underneath the 14-day SMA indicator, which is at the $22.22 point. The Stochastic Oscillators are in the oversold region, seemingly consolidating at the 9.64 and 5.92 levels. A breach of the upper line drawn will allow the price to drop back into its previous range-bound trading style.
Will the SOL/USD market bear step up their efforts to reclaim lows in the $20 and $10 ranges?
A long-holding of positions around the $20 may eventually allow the SOL/USD market bears to push for lows back into the previous range-bound zones as identified that the crypto market emerges with a critical session around the point first mentioned. The Stochastic Oscillators will be extremely useful in determining whether a swing high-motion will resume when a condition suggests that the blue line will cross the red line in the northbound direction.
On the downside of the technical analysis, as there has been a convergence of candlesticks closely below the resistance point of $25 to the lower of $20, sellers should continue to hold down the market valuation underneath the higher value to truncate the possibility of the crypto economy from metamorphosing into higher-trading zones that could price far-reaching above the p[revious range-bound spots indicated above.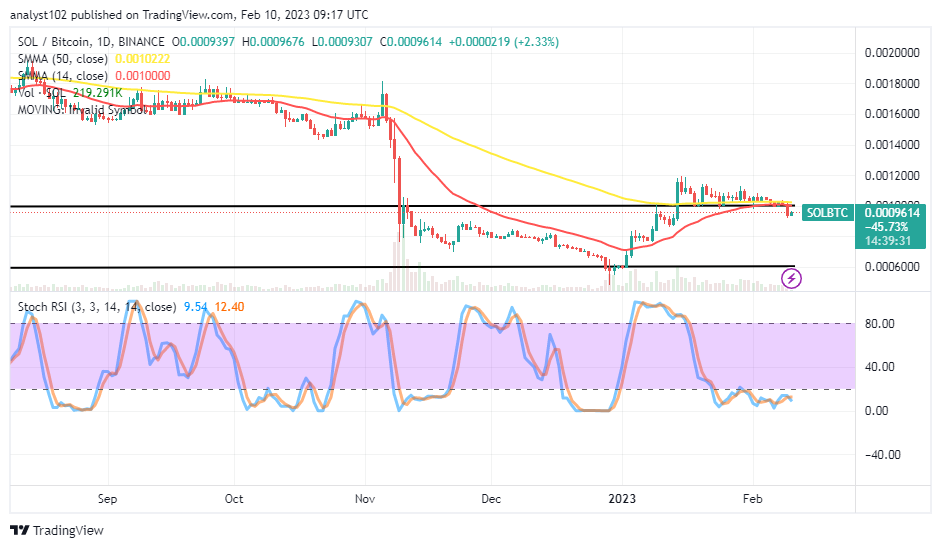
SOL/BTC Price Analysis
Solana’s trending ability contrasting with the Bitcoin market emerges with a critical trading session around the trend lines of the SMAs. The 14-day SMA indicator has traversed northward to touch the 50-day SMA indicator at a higher-trading zone. The Stochastic Oscillators are in the oversold region, maintaining 12.40 and 9.54 levels. It shows the base crypto is still under a relatively-debasing force, pairing with its counter-trading crypto. It would be psychologically justifiable for traders to be cautious about executing any position.
Note: Cryptosignals.org is not a financial advisor. Do your research before investing your funds in any financial asset or presented product or event. We are not responsible for your investing results.
You can purchase Lucky Block here. Buy LBLOCK