Synthetix (SNX/USD) Dives Into Demand Zone
Estimated Reading Time: 2 minutes
Don’t invest unless you’re prepared to lose all the money you invest. This is a high-risk investment and you are unlikely to be protected if something goes wrong. Take 2 minutes to learn more
SNX Market Analysis
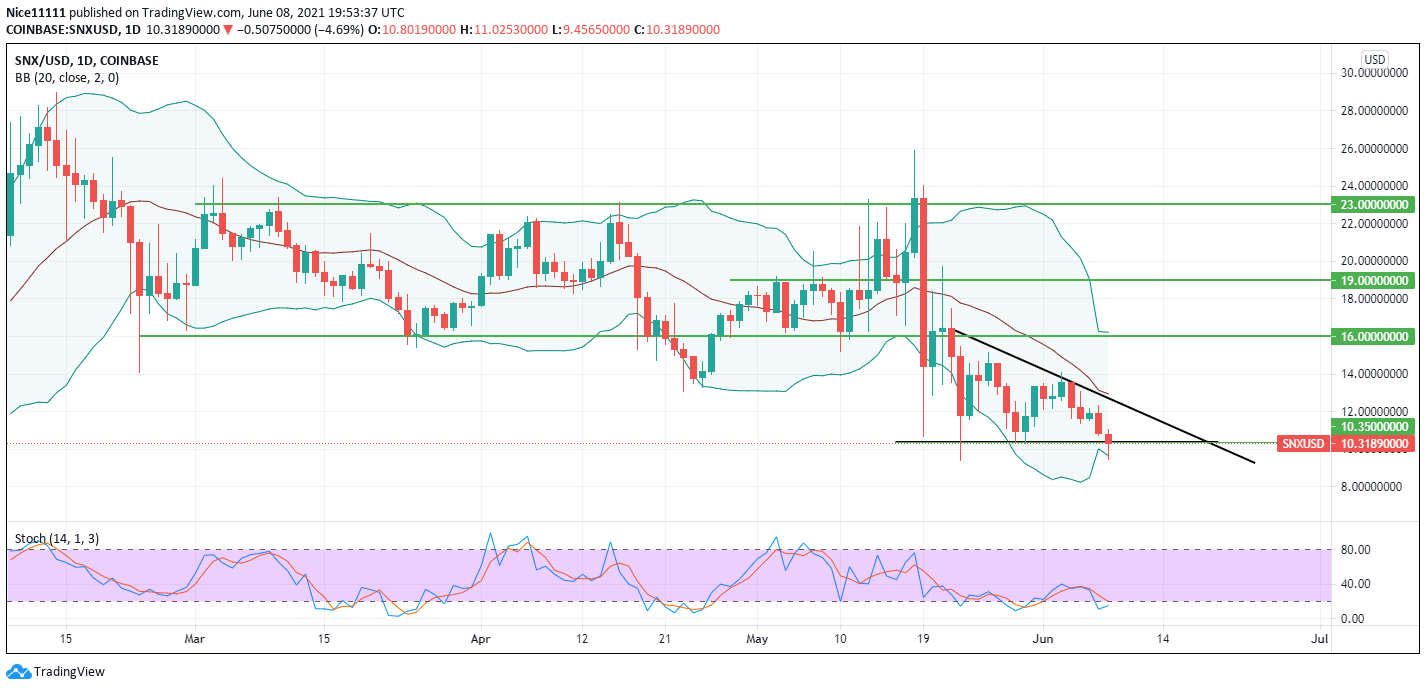
Synthetix has posted lower highs without concurrent lower lows. The volatile dive in price since the 19th of May has failed to break through the demand zone at $10.350. Price is seen to bounce on the zone multiple times. The market revealed sharp rejection at the demand zone with a long wick beneath the bearish candle’s body for that day. 
The market made a second attempt on the 29th of May but failed to break through the thoroughly defended zone. Currently, the market has reached for the zone which makes the third time since the sudden plunge in price on the 19th of May. The failure to break the zone multiple times has formed a descending triangle in the market.
SNX Key Levels
Demand Zones: $10.350, $16.000
Supply Zones: $23.000, $23.000
SNX Market Anticipation
The market has posted a wick just below the demand zone on the bearish daily candle. The wick appears to be a take-off sign. 
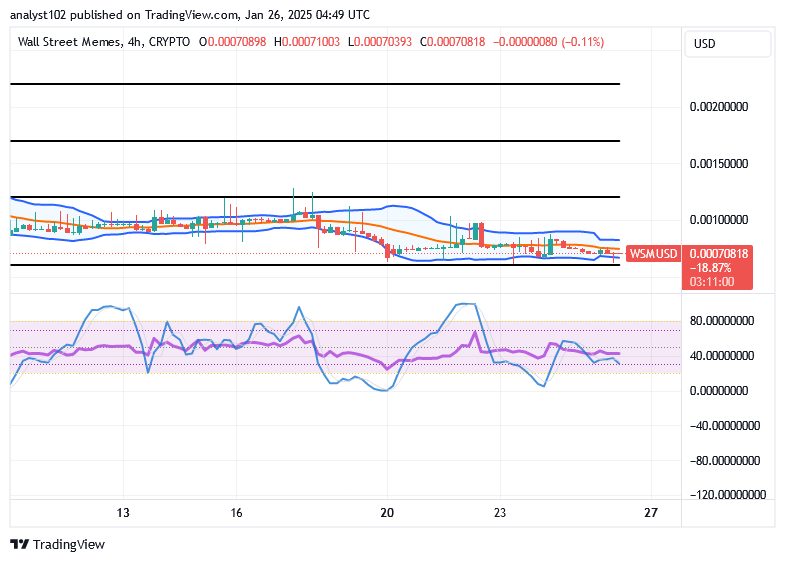
The four-hour chart shows a tweezer bottom which is a bullish reversal sign. The Stochastic Oscillator on the four-hour chart is seen to take off from the oversold region which correlates with the indicator on the daily showing oversold. The daily bearish candle has dived into the longer Bollinger band. Price has moved slightly higher since it touched the indicator’s lower band.
The market is likely to fill up the descending triangle before it eventually breaks out higher to reach $16.000.
Note: Cryptosignal.org is not a financial advisor. Do your research before investing your funds in any financial asset or presented product or event. We are not responsible for your investing results.