The $SPONGE (SPONGE/USD) Market: A Tightrope Walk Between Bulls and Bears
Estimated Reading Time: 3 minutes
Don’t invest unless you’re prepared to lose all the money you invest. This is a high-risk investment and you are unlikely to be protected if something goes wrong. Take 2 minutes to learn more

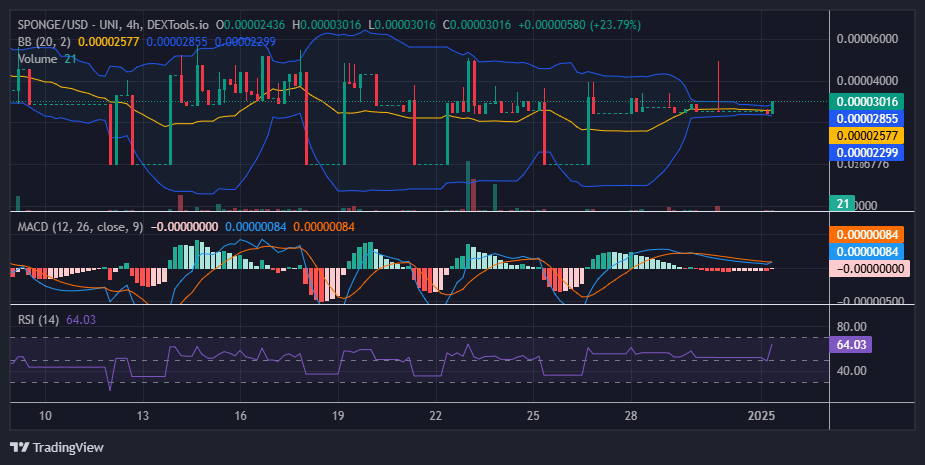
The $SPONGE market currently resembles a tightrope walk, with bullish and bearish forces locked in a fierce struggle around the crucial $0.000026 support. While bears have stubbornly defended the formidable $0.00004 resistance, a shift in momentum is palpable. A recent surge has propelled the price to $0.00003, breaching the initial resistance and signaling a potential weakening of bearish grip.
This consolidation phase near $0.000026, while seemingly stagnant, could be the calm before the storm. A decisive breakout is imminent, with the potential for a significant price swing on the horizon.
Key Market Dynamics:
- Resistance Levels: $0.00005, $0.000055, $0.000060
- Support Levels: $0.000020, $0.0000195, $0.000019
$SPONGE (SPONGE/USD) Technical Outlook
The narrowing Bollinger Bands paint a picture of subdued volatility around the $0.000026 mark, suggesting a period of market equilibrium as buying and selling pressures neutralize each other. This consolidation phase could be a period of accumulation, potentially setting the stage for a dramatic $SPONGE price breakout.
The emergence of a marubozu candlestick signifies a powerful bullish surge, with the price surging from $0.000026 to $0.00003. This could be the genesis of a sustained uptrend. If the $SPONGE bulls can maintain this upward momentum, the price could rally towards the $0.00004 resistance and potentially establish a new higher support level at that juncture.
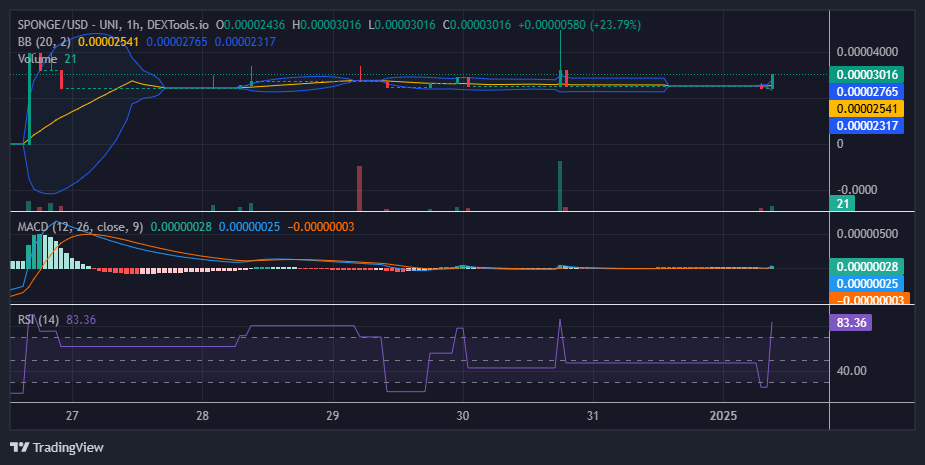
$SPONGE (SPONGE/USD) 1-Hour Chart Insights
Mirroring the 4-hour chart, the 1-hour chart also captures the bullish surge from $0.000026, marked by the formation of a marubozu candlestick. However, this candlestick extends beyond the upper Bollinger Band, suggesting a potential overbought condition. This rapid price movement could introduce heightened market volatility.
This assertion is supported by the trade volume indicator, where the volume fails to keep pace with the intensity of the price action, indicating weaker underlying market support. While earlier analyses predicted RSI stabilization around 55, recent abrupt price spikes have disrupted this equilibrium, amplifying market volatility.
This heightened turbulence could fuel a fresh price rally, presenting an opportunity for bulls to leverage this volatility and propel the market further upward.
Buy SPONGE/USD!
HAPPY NEW YEAR $SPONGE FAM 🔥
2025 gonna be soooo DAMP 💦💦 pic.twitter.com/Xbd83ptvBp
— $SPONGE (@spongeoneth) January 1, 2025
Join the SPONGE community and be part of the next big crypto sensation! Buy Sponge ($SPONGE) today!