UMA (UMAUSD) Battles $14.00 Resistance to Escape Depression
Estimated Reading Time: 2 minutes
Don’t invest unless you’re prepared to lose all the money you invest. This is a high-risk investment and you are unlikely to be protected if something goes wrong. Take 2 minutes to learn more
UMAUSD Key Levels
Demand Levels: $14.00, $19.75, $25.90
Supply Levels: $1.10, $5.70, $10.00
UMA Market Analysis
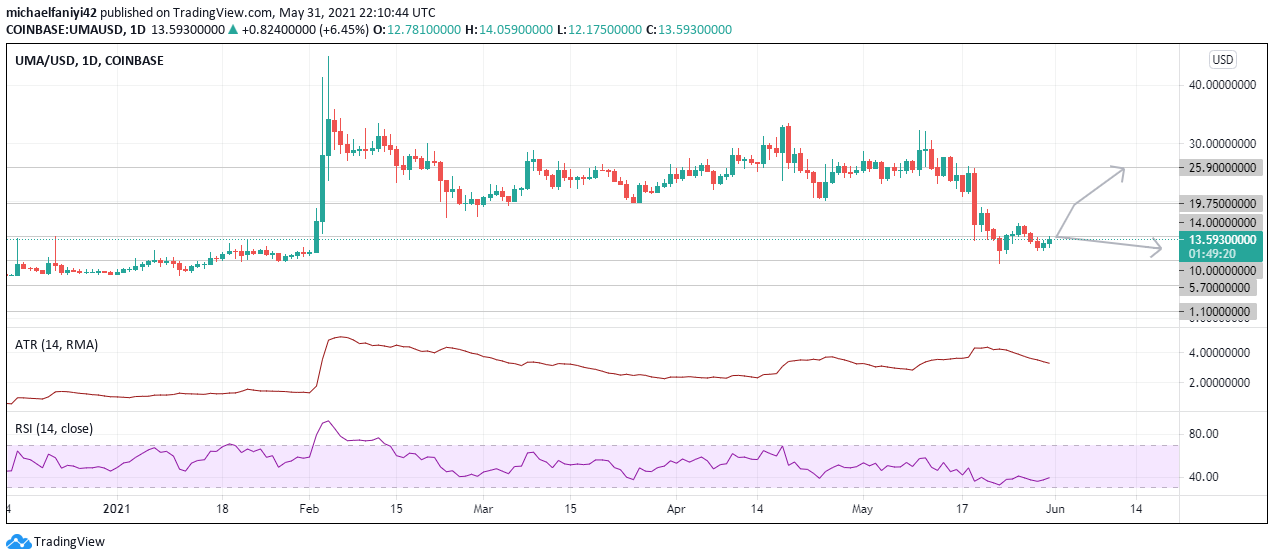
UMAUSD has been battling to escape depression since a rapid fall in price earlier in the month on the 19th of May. Price had fallen from a height of $25.90 and plunged to $14.00 in one day. After holding on for a while, $14.00 gave way for the price to fall further to $10.00, where the price found adequate support for an immediate rally. However, $14.00 resistance would not bulge easily. The bulls managed to push the price above the zone on the 26th of May, but it fell right back through after 2 days. 
UMAUSD is currently appraising the zone in another attempt to break through away from depression. $14.00 is a strong weekly resistance. It has previously been responsible for keeping the market quiet for a long period till an unprecedented surge of price upwards from 2nd of February to 4th of February 2021.
What to Expect From UMAUSD
The market has displayed a small bullish candle whose wick is already touching the $14.00 resistance. The ATR (Average True Range) indicator is showing a progressive reduction in market volatility. The signal line is currently at 3.28. Low volatility also has contributed to the reason that price hasn’t been able to break upwards of $14.00.
The RSI (Relative Strength Index) is only a little above the oversold region and facing upwards at 40.00. This seems to suggest that the price could go upwards as there is still much scope for upwards movement. If the bulls succeed, UMA could reach for the next resistance at $19.75.
The RSI on the four-hour chart is at 51.89 and still facing upwards. This shows progressive bullish activities. Meanwhile, the ATR is at a low of 0.80, a 56% decrease in volatility from 1.80 on the 19th of May when the price plunge happened.
The chart shows the price to have retested the $14.00 a couple of times before now and the price could finally break through to reach higher levels.
Note: new.cryptosignals.org is not a financial advisor. Do your research before investing your funds in any financial asset or presented product or event. We are not responsible for your investing results.