$SPONGE (SPONGE/USD): Bullish Traders Continue to Orchestrate the Price Rally
Estimated Reading Time: 3 minutes
Don’t invest unless you’re prepared to lose all the money you invest. This is a high-risk investment and you are unlikely to be protected if something goes wrong. Take 2 minutes to learn more
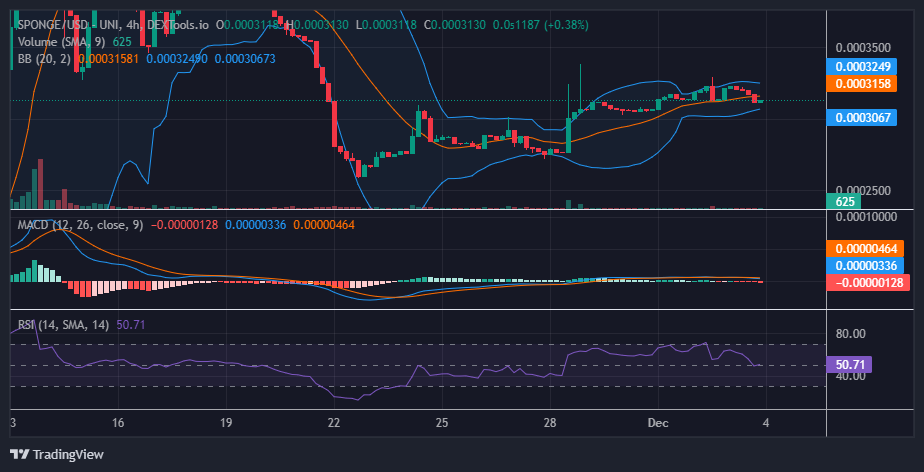
Bullish traders in the SPONGE/USD market have surpassed expectations by driving the price above the $0.00031 threshold. In the previous market analysis, we observed the resilience of the bullish stance against bearish pressure as it maintained support at the $0.00031 level. Considering historical market behavior, there are compelling reasons to anticipate a sustained upward trend. Notably, given that the price reached the $0.00034 level in late November, there is a likelihood of a potential rally back to this level in the near future.
Critical Price Levels:
- Resistance: $0.00035, $0.00040, and $0.00045.
- Support: $0.000250, $0.00020, and $0.00019.
In-Depth Technical Insights for $SPONGE (SPONGE/USD) Price Analysis:
While the $0.00034 price level may serve as a potential near-term resistance, representing a point where the SPONGE/USD bull market could encounter some bearish pressure, bullish traders remain focused on the $0.0004 price level. This particular level holds significance as it marks the starting point of the last bearish cycle.
Nevertheless, the Moving Average Convergence and Divergence (MACD) indicator suggests that the current bullish momentum may lack significant strength, as the difference between the signal line and the MACD line is relatively small. Despite this observation of weak bullish momentum, the bullish market remains progressive, and there is a possibility of reaching the $0.0004 price mark in the near future.
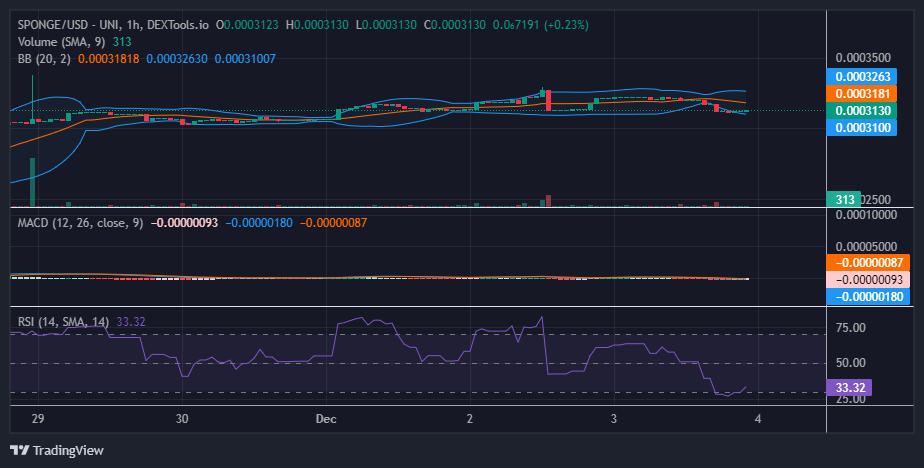
Short-Term Outlook on the 1-Hour Chart:
Moreover, when examining the market from a 1-hour chart perspective, a bullish trend is evident. The Relative Strength Index (RSI) currently registers at 63, indicating bullish sentiment. It is noteworthy, however, that the RSI line has recently shifted in a downward direction. This change is attributed to a resistance level the market is currently facing as it approaches the $0.00034 price threshold.
Despite this downward movement in the RSI line, there is optimism that the prevailing bullish sentiment will overpower the cluster of sell orders at this price level, propelling the market forward toward the $0.0004 target.
If someone insults $SPONGE.
When someone disses $SPONGE 💪🧽#Web3 #Crypto #MemeCoin #Alts pic.twitter.com/1DSsoMyKfN
— $SPONGE (@spongeoneth) December 4, 2023
Invest in the hottest and best meme coin. Buy Sponge ($SPONGE) today!