XRP (XRP/USDT) Eyes Potential Rebound Despite Market Condition
Estimated Reading Time: 3 minutes
Don’t invest unless you’re prepared to lose all the money you invest. This is a high-risk investment and you are unlikely to be protected if something goes wrong. Take 2 minutes to learn more

XRP Long-term Analysis: Ranging
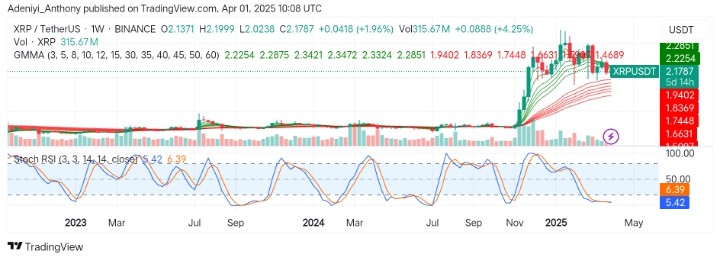
The market for XRP against the Tether in past weeks has experienced strong volatility within the $3.000 and $2.000 critical levels. However, the current price movement shows the pair has seen a gain of 1.96%, suggesting an active market activity with the Guppy Multiple Moving Averages (GMMAs) and Stochastic RSI signaling a potential rebound might be on the horizon.
Recently, the pair saw a prolonged bullish momentum as its value reached $2.200 before being neutralized by bearish activities. However, the current market sentiment shows that the pair is preparing for a breakout as the indicators suggest a move in either direction.
Currently, XRP trades at $2.1787, with over 300 million traded volumes this week already.
Technical Indicators
Major Resistance Levels: $2.254, $2.3400, and $.25000
Major Support Levels: $1.9402, $1.8369, and $1.6631
XRP Technical Analysis
The analysis of XRP against the USDT in the past months has shown that the pair has experienced a significant rally before the current consolidation phase, suggesting a slowing down of momentum. The GMMAs signal a bullish market as the short-period EMAs are still positioned above the long-period EMAs. However, the convergence of the sets of EMAs suggests the current move lacks strong conviction.
On the other hand, the Stochastic RSI operates in the oversold region, signaling a strong position for potential reversal of bullish participation increases.
To this end, a breakout above $2.254 would indicate a strong bullish trend; otherwise, the pair’s price might continue the range-bound movement.
XRP/USDT Analysis: Where from Here?
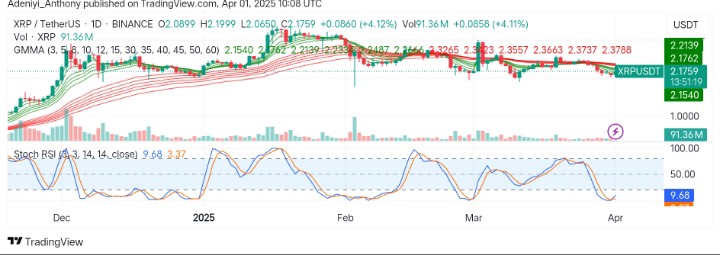
On the daily chart, XRP/USDT remains in the corrective phase as the GMMAs present a bearish crossover. However, the narrowing of the lines suggests a reduced bearish pressure as the pair sees a massive 4.12% gain.
Additionally, the oscillator beneath the chart shows the pair is recovering from an oversold region, as the market sees a volume spike. This signals a bullish bounce, which is likely in the short term.
As it stands, XRP/USDT could bounce back towards $2.2400 before facing strong resistance at $2.3500 in the near term.
You can purchase crypto coins here. Buy LBlock