XRP (XRP/USDT) Sees a Price Surge with $3.000 in Sight
Estimated Reading Time: 3 minutes
Don’t invest unless you’re prepared to lose all the money you invest. This is a high-risk investment and you are unlikely to be protected if something goes wrong. Take 2 minutes to learn more
XRP Long-term Analysis: Bullish
The market for XRP against the Tether recently has been experiencing bullish momentum with its price surging past major resistance. However, the recent price movement suggests a more uptrend, fueled by the growing bullish participation. With the current trajectory, the pair could be targeting the psychological $3.000 level, as the pair’s price receives more bullish support.
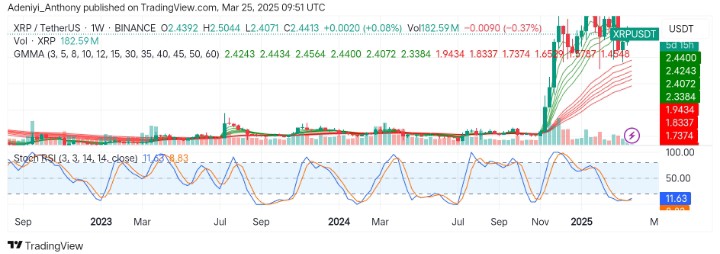
Currently, XRP trades at $2.4071 with over 182 million traded volumes this week.
Technical Indicators
Major Resistance Levels: $2.5044, $2.8000, and $3.0000
Major Support Levels: $2.4000, $2.3384, and $2.0000
XRP Technical Analysis
The analysis of the XRP against the Tether on the weekly timeframe shows that the pair has seen a price surge recently, moving to the north with more bullish engagements.
The Guppy Multiple Moving Averages (GMMAs) are also showing clear upside signs as the short-period EMAs diverge upward. This signals a strong bullish sentiment and more accumulation by the buyers.
On the other hand, the Stochastic RSI signals the pair is recovering from an oversold region with the lines showing early signs of improvement to the north.
To this end, XRP might need to stabilize above immediate resistance for a confirmed move toward $3.000 in the coming session; otherwise, a range-bound movement might be seen.
XRP/USDT Analysis: What’s Happening Here?
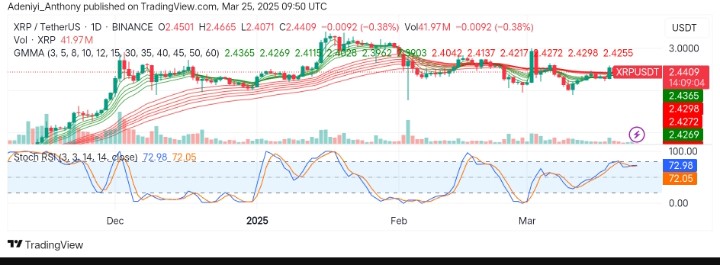
On the daily timeframe, XRP/USDT is moving sideways after a slight dip of 0.38%, suggesting a consolidation phase after months of strong rally.
The GMMAs signal a bullish trend is still intact. However, the gap between the short and long-period EMAs suggests reduced momentum as the price falls from a recent level.
From another angle, the Stochastic oscillator’s lines are currently, at 72.98 and 72.05, indicating the pair nears an overbought zone and a short-term correction might materialize.
To this end, the bullish momentum looks weakened as a break below $2.4000 might trigger a further downturn toward $2,3384. Conversely, a hold above $2.4200 could indicate regained momentum.
You can purchase crypto coins here. Buy LBlock