XRP (XRP/USDT) Gearing Up for More Gains
Estimated Reading Time: 3 minutes
Don’t invest unless you’re prepared to lose all the money you invest. This is a high-risk investment and you are unlikely to be protected if something goes wrong. Take 2 minutes to learn more
XRP Long-term Analysis: Bullish
The market for XRP against the Tether has shown resilience, ranging within the $2.000 level after last year’s strong bullish momentum.
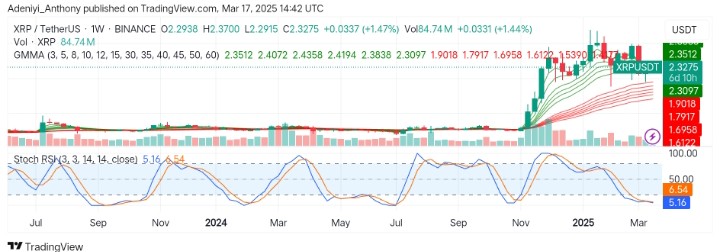
However, Despite the recent downside movement recorded by the pair in recent weeks. The price appears to be gaining traction on the weekly chart as the Guppy Multiple Moving Averages (GMMAs) and the Stochastic oscillator suggest more gains might be recorded.
Recently, the activities of the buyers indicate a target lock to the North, as the market sees an increase in participation. However, the oscillator beneath the chart signals more confirmation is needed for a long position, as the lines show no clear direction.
Currently, XRP trades at $2.3273, with over 84 million traded volumes already.
Technical Indicators
Major Resistance Levels: $2.3541, $2.408, and $3.000
Major Support Levels: $2.3101, $1.9020, and $1.7919
XRP Technical Analysis
The weekly analysis of XRP against the Tether shows that the pair is aiming at the $2.500 critical level as the influx of bullish traders goes up, the GMMAs displaying overall bullish sentiment for the market.
However, the Stochastic RSI signals an oversold condition for the market as the blues stretch below the orange lines, indicating mild selling pressure.
To this end, the price may need to break above $2.3500 for a confirmed upside movement; otherwise, a fall below $2.3101 may erode the current 1.47% gain.
XRP/USDT Analysis: Where from Here?
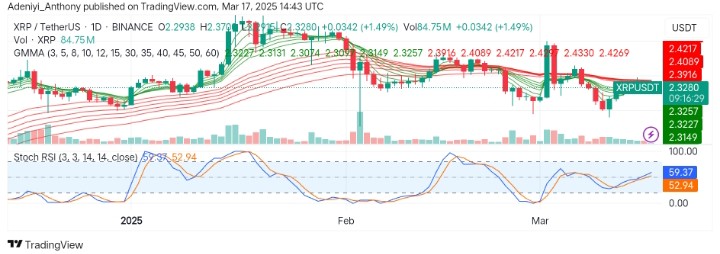
On the daily timeframe, XRP/USDT prepares for a bullish breakout as the short-period EMAs converge toward the long-period EMAs from below.
Beneath the chart, the Stochastic RSI signals a neutral position as the lines operate around the 50-mark level. However, with the blue line above the orange line, an improvement to the North would indicate a breakout as the pair targets a space above the long-period EMAs.
Therefore, more bullish participations are needed for a bullish breakout; otherwise, the price may continue to oscillate at the current level.
You can purchase crypto coins here. Buy LBlock