Band Protocol (Band/USD) Stretches Out for the Moving Average
Estimated Reading Time: 3 minutes
Don’t invest unless you’re prepared to lose all the money you invest. This is a high-risk investment and you are unlikely to be protected if something goes wrong. Take 2 minutes to learn more
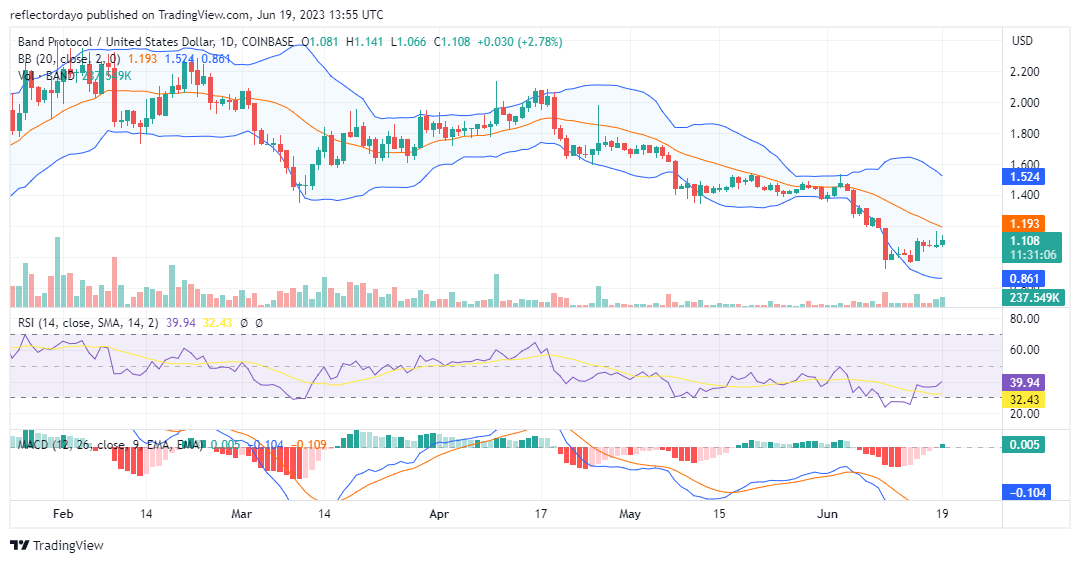
The Band Protocol bear market started on April 17 and has brought the market to a year-low of $0.906. Traders were not willing to buy below this price level. Therefore, at the support level formed at $0.971, the price began to rebound. Today, the market has seen some notable bullish performance as the price nears the moving average.
Band Protocol Market Data
- BAND/USD Price Now: $1.105
- BAND/USD Market Cap: $139,217,937
- BAND/USD Circulating Supply: 126,736,818
- BAND/USD Total Supply: 135,536,818
- BAND/USD CoinMarketCap Ranking: #158
Key Levels
- Resistance: $1.193, $1.524, and $1.867
- Support: $0.861, $0.800, and $0.750.
Price Prediction for Band Protocol: The Indicators’ Point of View
Band Protocol hit its lowest point in the year; it was reckoned by the Relative Strength Index to be in the oversold region. So the market turned around from the level and, on June 15, made a notable bullish move that launched it out of the oversold region but still within the sell zone. That means the bears are still winning. The bull market of June 15, however, faced a strong barrier at $1.102. This resistance level has kept trimming off all bullish attempts to propel the market in the upside direction since then. It is a concern that today’s bullish move might also be cut short at the resistance level. If that happens, the market will continue to range sideways around this level.
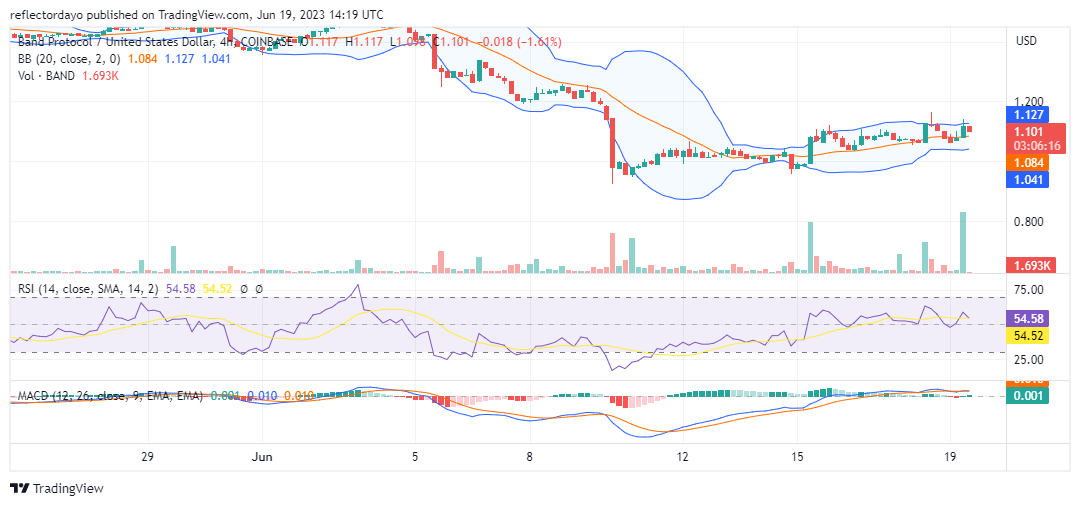
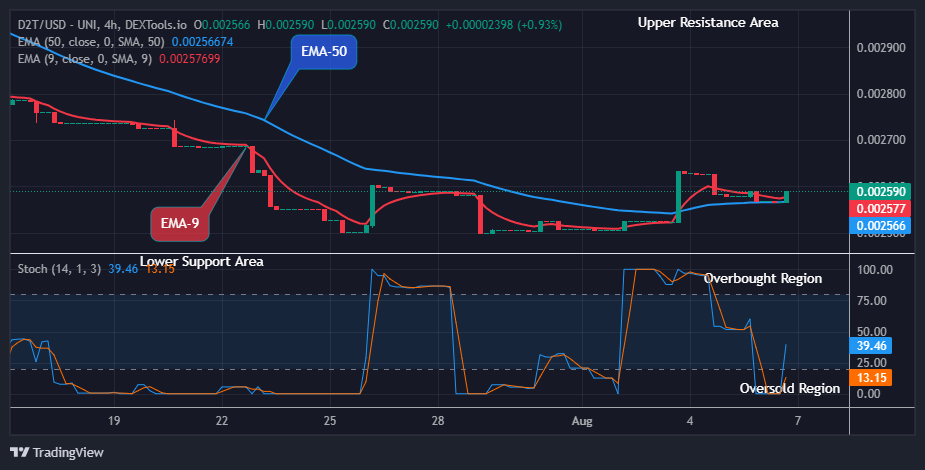
BAND/USD 4-Hour Chart Outlook
In the third trading session for today, we noticed a spike in investors’ interest, which was reflected by the trading volume indicator with a tall histogram. But the candle representing the session did not commensurate with the bullish volume histogram. The failure of the candlestick to reflect the same level of bullishness as the volume histogram for the third session implies a lack of follow-through on the part of the buyers. The buyers became exhausted. They appear weak to break the $1.102 resistance level. The market needs more demand to do this. From the standpoint of the 4-hour timeframe, it is likely for the market to consolidate at this level. The consolidation is more likely to strengthen a support level than a resistance level.