Annual Forecast for Cardano (ADA), 2022
Estimated Reading Time: 3 minutes
Don’t invest unless you’re prepared to lose all the money you invest. This is a high-risk investment and you are unlikely to be protected if something goes wrong. Take 2 minutes to learn more
Cardano (ADA) Price Long-Term Forecast: Bearish
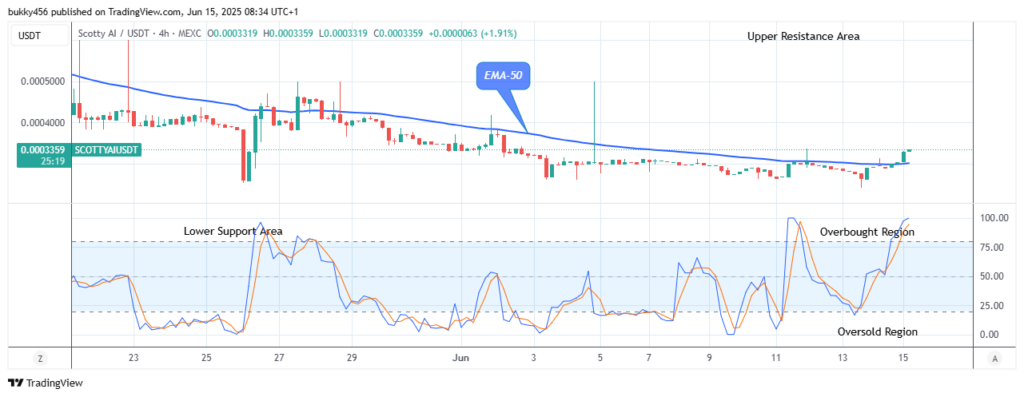
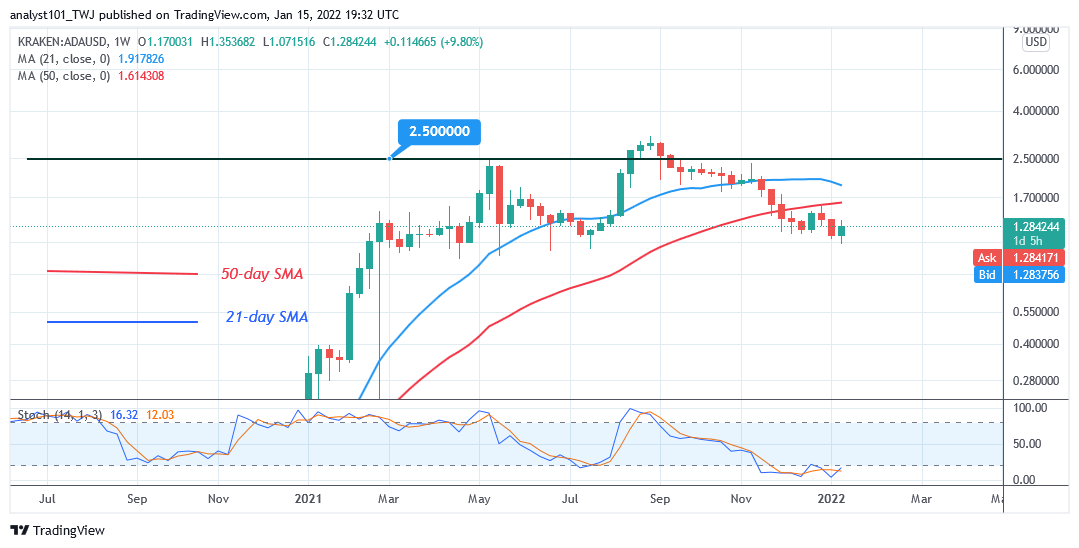
Cardano’s (ADA) price has been in a downward move as it finds support above $1.18. ADA’s price is in a false breakout at the $2.50 overhead resistance. The bullish momentum could not be sustained above the overhead resistance as the market reached the overbought region. In retrospect, Cardano has been in a sideways trend after attaining a peak price of $2.50 on May 10, 2021. Thereafter, the cryptocurrency declined to the $0.950 low and commenced a sideways move. On August 16, 2021, buyers resumed a fresh uptrend and retested the overhead resistance. Today, the market has declined below the moving averages. The downtrend has subsided as the market reached the oversold region.
Cardano Chart Indicators Reading
On the weekly chart, Cardano is below the 20% area of the daily stochastic. It indicates that the market has reached the oversold region. The selling pressure is likely to end as buyers emerge in the oversold region. The current support above level 1.2800 is likely to hold. Also, the altcoin is at level 54 of the Relative Strength Index for period 14. It indicates that Cardano is in the uptrend zone and capable of rising on the upside.
Technical Indicators
Key Resistance Zones: $3.00, $3.50, $4.00
Key Support Zones: $2.50, $2.00, $1.50
Cardano (ADA) Medium-term Trend: Bearish
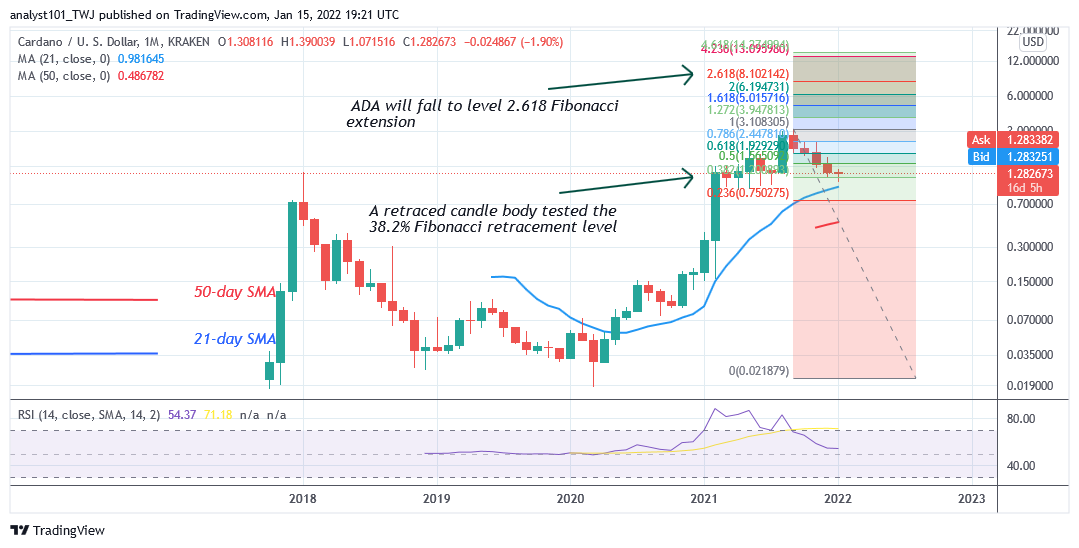
On a Monthly chart, Cardano is in an uptrend. ADA price has retraced to the support above the 21-day line moving averages. This is an indication of a further upward movement of the cryptocurrency. Meanwhile, on September 1 uptrend; a retraced candle body tested the 38.2% Fibonacci retracement level. The retracement suggests that ADA will rise to level 2.618 Fibonacci extension or $8.10.
What Is the Next Move for Cardano (ADA)?
Cardano’s downward move has reached bearish exhaustion as it finds support above $1.18 . The market will resume upward as the current support holds. ADA/USD is likely to rise to $8.10 in 2022 as per the Fibonacci tool analysis. Nonetheless, buyers will have to clear the $3.00 resistance.
You can purchase crypto coins here. Buy Token
Disclaimer. This analysis and forecast are the personal opinions of the author are not a recommendation to buy or sell cryptocurrency and should not be viewed as an endorsement by CoinIdol. Readers should do their own research before investing funds.