Ripple (XRP/USD) Advances Slightly Above the $0.5404 Level
Estimated Reading Time: 3 minutes
Don’t invest unless you’re prepared to lose all the money you invest. This is a high-risk investment and you are unlikely to be protected if something goes wrong. Take 2 minutes to learn more
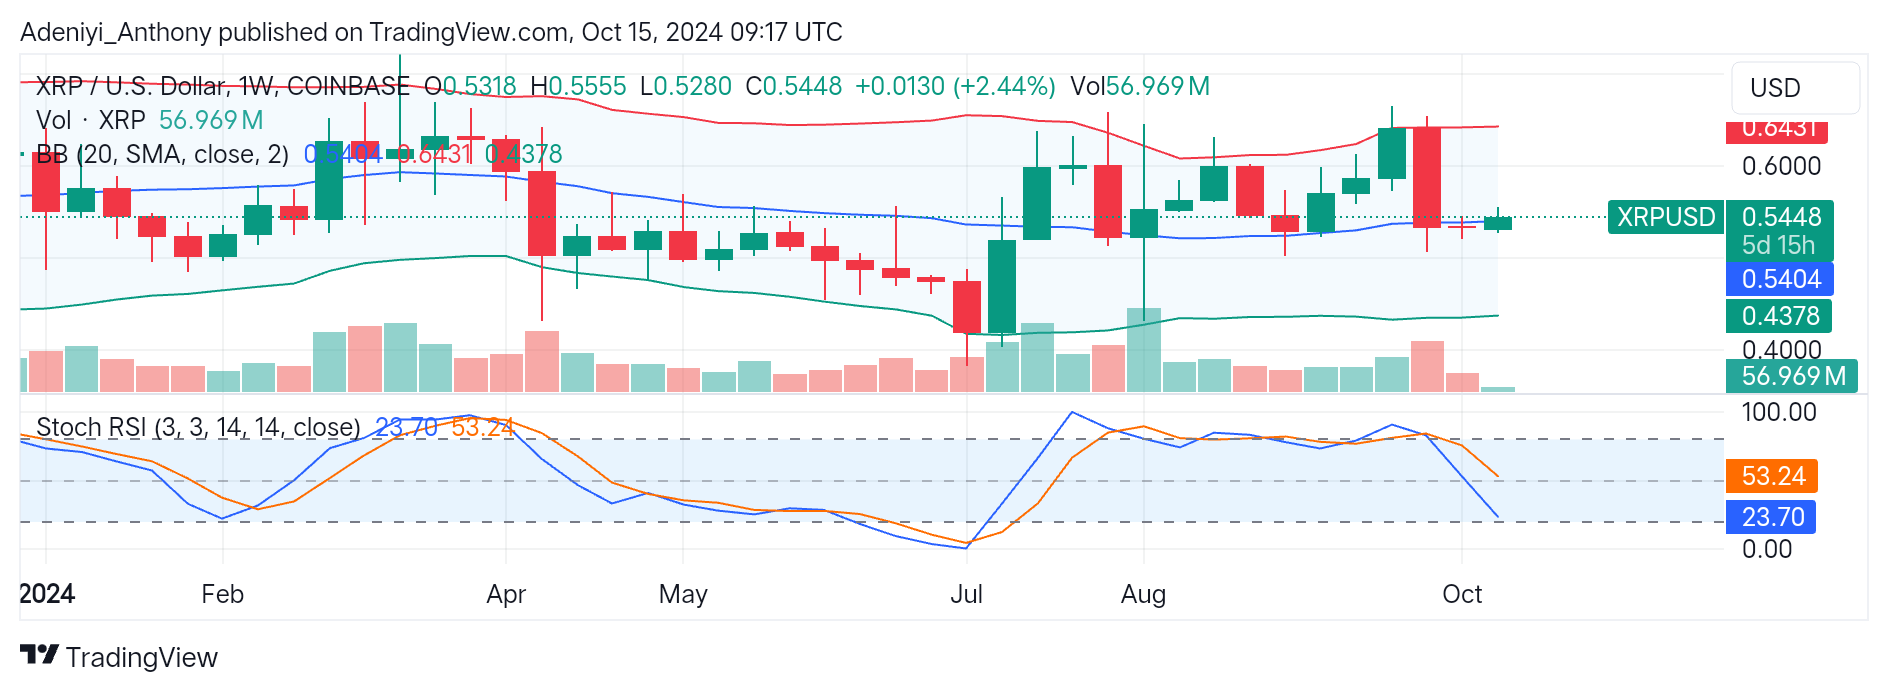
The Ripple (XRP) against the U.S. Dollar (USD) on the weekly chart for some periods appears to be in a range-bound movement with a slight bullish movement after testing the dynamic support level.
For months, XRP/USD has been consolidating between the upper limit of the Bollinger bands. This suggests the indecisive nature of the market traders. However, despite the steady trading volume in the market, the pair is yet to take a clear direction due to a drop in market volatility.
For a bullish breakout to take effect, the price must operate above the $0.6431 with a strong volume; otherwise, a spike in volume with a price below the $0.4378 level could lead to a fall in the pair’s price.
Presently, XRP/USD trades at $0.5448, a 2.44% positive change compared to last week’s trade.
XRP Technical Indicators
Major Resistance Levels: $0.5555, $0.6000, and $0.6431
Major Support Levels: $0.5404, $0.4378, and $0.4000
Ripple Technical Indicator Analysis
The recent ripple price action between the middle and higher Bollinger bands suggests lack of traders’ interest and direction in the market. However, the most recent price action around the mid-band indicates the market hints at a potential breakout. Therefore, a break above the $0.6431 or below the middle band would signal a potential trend.
The Stochastic RSI on the downside of the chart appears to be somewhat closer to the oversold region. However, a bullish reversal will be confirmed if the line indicator crosses and makes an upward movement; otherwise, the pair might be a prolonged consolidation or a downtrend.
XRP/USD Analysis: Where From Here?
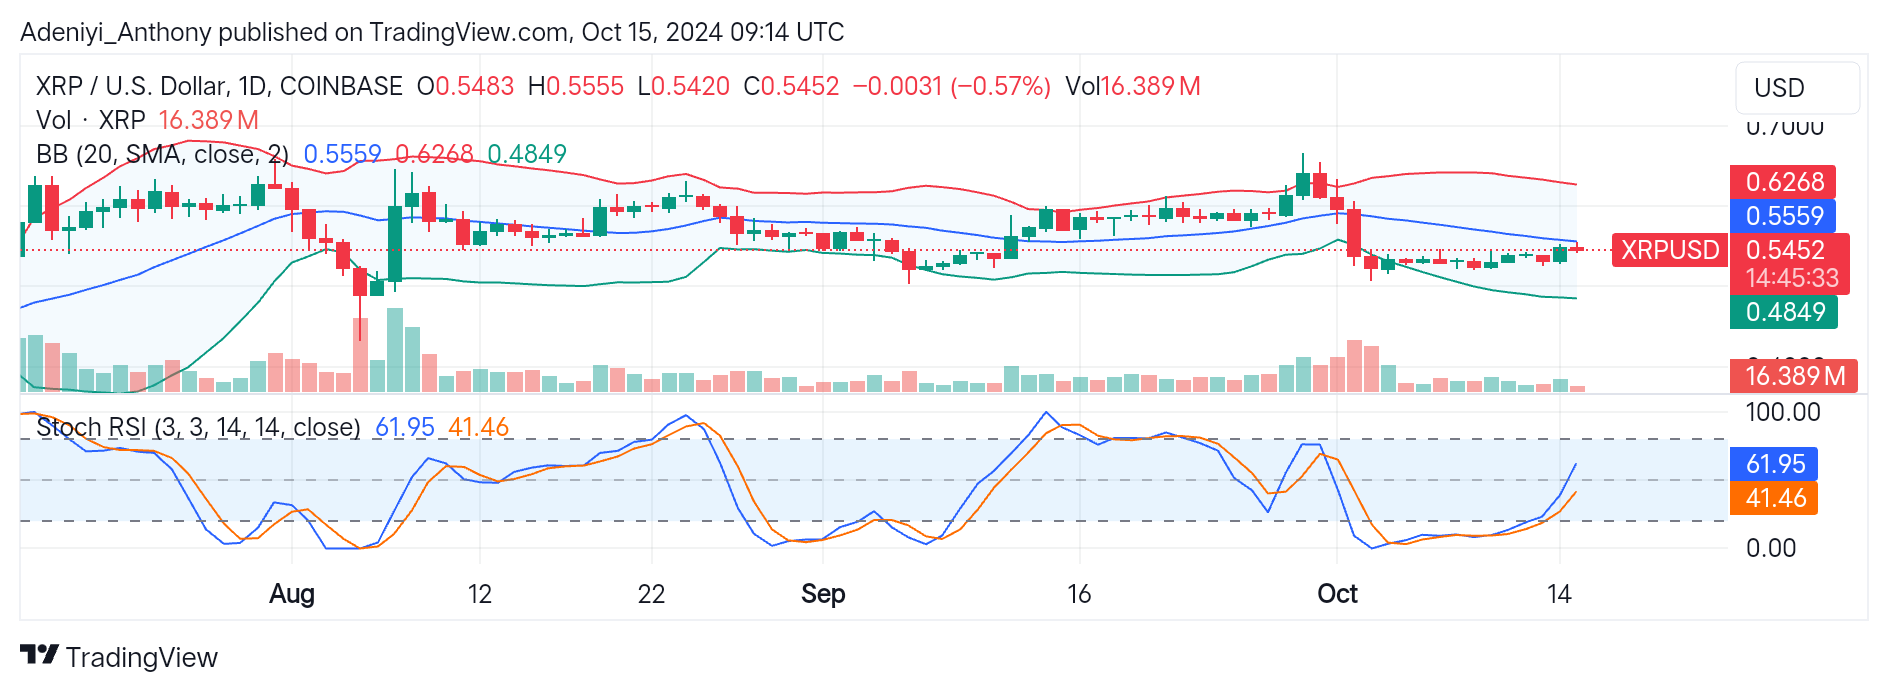
On the daily chart, XRP/USD appears to be consolidating between the lower and the middle bands. Also, the recent price movement suggests the pair is aiming at the middle Bollinger band. A break above this $0.5559 level would indicate the possibility of further upside movement.
On the other hand, the Stochastic RSI is in a neutral zone with a projection towards the bullish region. However, if the line crosses over, a downside movement towards the lower band at $0.4849 immediately after the $0.5000 psychological level may play out.
You can purchase crypto coins here. Buy LBlock