Zksync (ZK/USD) Sees Price Decline Despite Prevailing Oversold Condition
Estimated Reading Time: 3 minutes
Don’t invest unless you’re prepared to lose all the money you invest. This is a high-risk investment and you are unlikely to be protected if something goes wrong. Take 2 minutes to learn more

The price of Zksync against the U.S. dollar has been declining with the formation of lower highs and lower lows. However, technical indicators on this chart suggest a potential reversal to the upside.
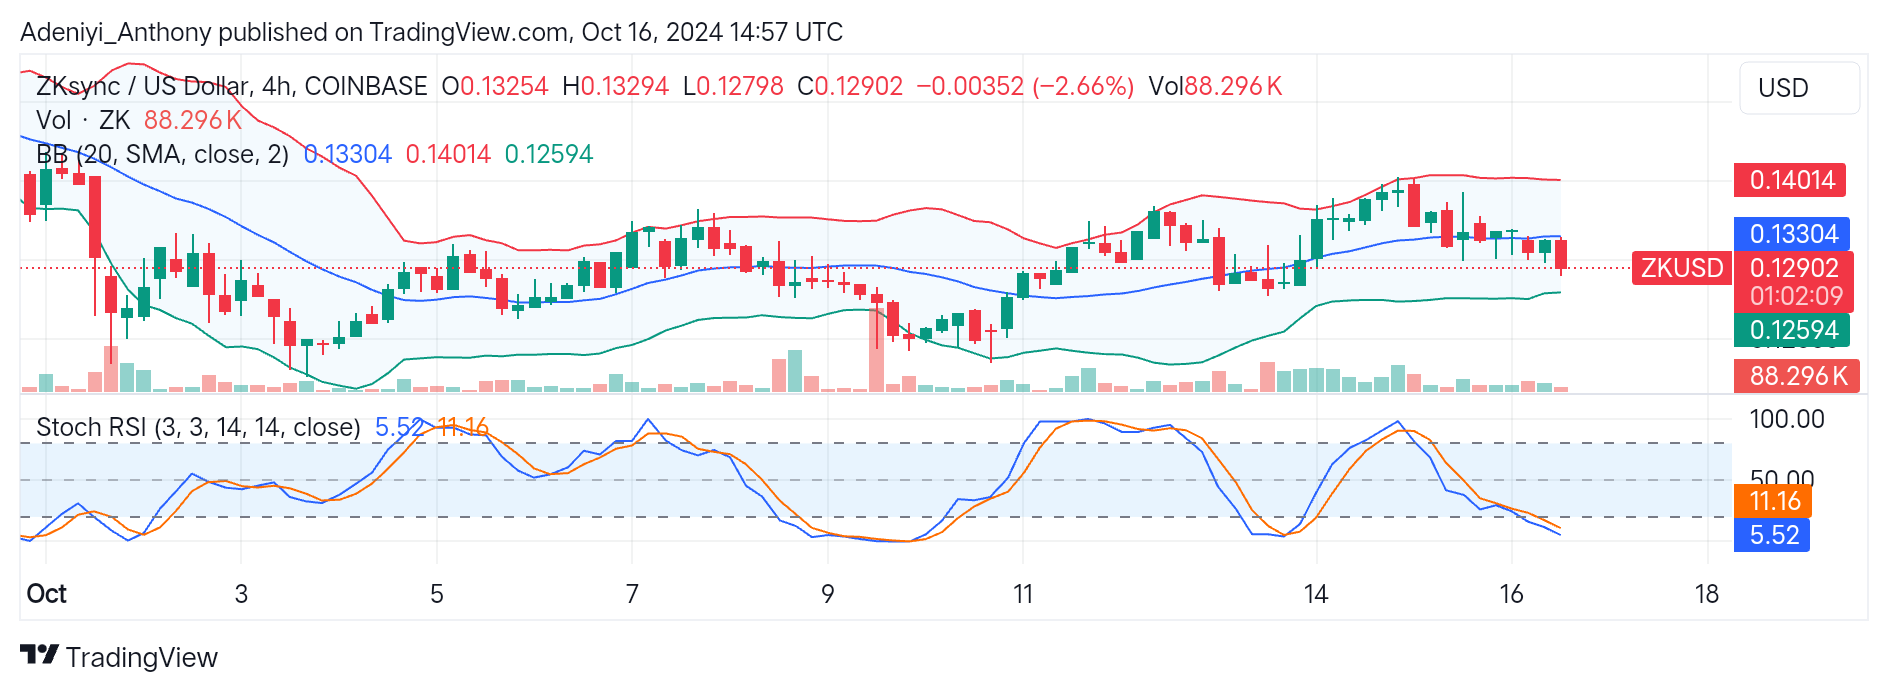
ZK/USD’s recent price movement between the middle and lower Bollinger bands suggests the intense selling pressure prevailing in the market. However, the current oversold condition specified by the Stochastic Relative Strength Index (RSI) suggests a potential reversal to the upside is on the horizon.
At present, traders are watching the key level as the price of the pair sits at $0.12902 under the dynamic moving average of $0.13304. However, the drop in volume and volatility suggests the market is in consolidation, preparing for a breakout. Whether the breakout will be in favor of the bulls or the bears remains uncertain.
ZKsync Technical Indicators
Major Resistance Levels: $0.13304, $0.14014, and $0.15000
Major Support Levels: $0.12594, $0.12000, and $0.11000
Zksync Technical Indicator Analysis
Zksync’s price is currently at a critical juncture. While the Stochastic RSI suggests that a bounce or short-term rally may be on the horizon. The recent price action between the lower segment of the Bollinger bands suggests the pair is in a deep oversold region and a possible reversal to the upside is possible.
However, for a correction to the upside to take place, the price of the pair must break above $0.13304. Otherwise, a break below $0.12594 would signal a continued downtrend.
Zksync Hints at a Possible Trend Continuation
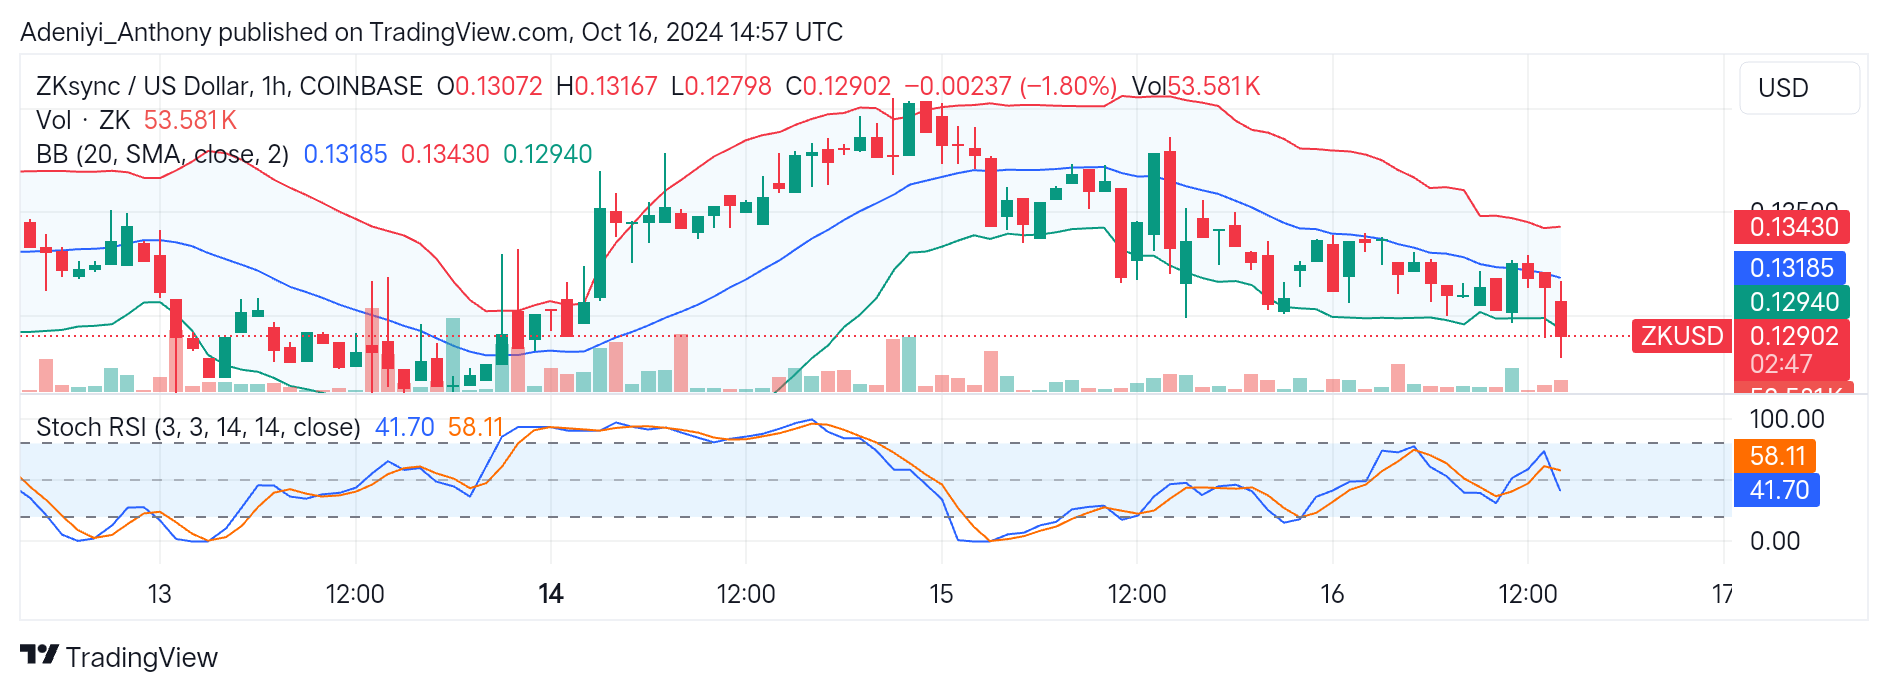
ZKSync on a 1-hour chart suggests a recent bearish movement as the price dipped to $0.12902 after a rejection from the higher resistance level.
The narrowed Bollinger bands in the timeframe suggest decreased volatility, and the price at the lower band indicates a test of support. However, this price movement isn’t drastic, implying consolidation or indecision in the market.
On the downside, the Stochastic oscillator indicates there might be a further downtrend or a short-term pullback. However, the lines on the indicator must cross over before a reversal can be confirmed.
You can purchase crypto coins here. Buy LBlock